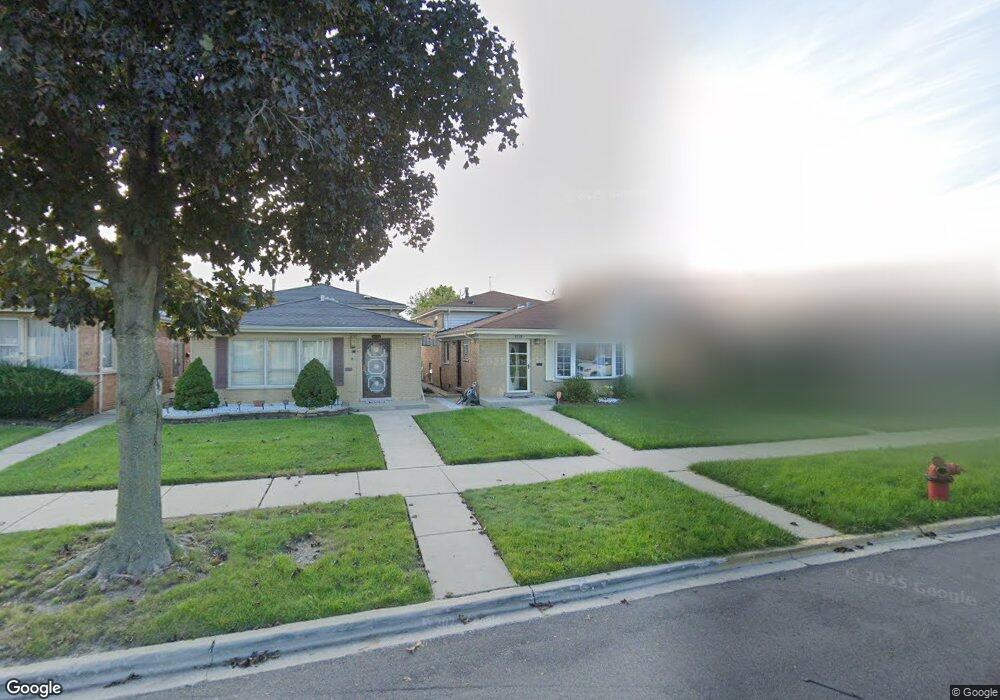
8228 S Mozart St Chicago, IL 60652
Wrightwood NeighborhoodEstimated Value: $244,000 - $341,000
3
Beds
2
Baths
1,500
Sq Ft
$191/Sq Ft
Est. Value
About This Home
This home is located at 8228 S Mozart St, Chicago, IL 60652 and is currently estimated at $286,860, approximately $191 per square foot. 8228 S Mozart St is a home located in Cook County with nearby schools including Carroll-Rosenwald Elementary School - Carroll Campus, Bogan Computer Technical High School, and CICS - Wrightwood.
Ownership History
Date
Name
Owned For
Owner Type
Purchase Details
Closed on
Apr 27, 2012
Sold by
Oliver Melvin C and Oliver Kristine L
Bought by
Mcarthur Latrice G
Current Estimated Value
Home Financials for this Owner
Home Financials are based on the most recent Mortgage that was taken out on this home.
Original Mortgage
$93,566
Outstanding Balance
$65,426
Interest Rate
4.25%
Mortgage Type
FHA
Estimated Equity
$221,434
Purchase Details
Closed on
Aug 2, 2004
Sold by
Washington David L and Washington Claretha
Bought by
Oliver Melvin C and Oliver Kristine L
Home Financials for this Owner
Home Financials are based on the most recent Mortgage that was taken out on this home.
Original Mortgage
$183,857
Interest Rate
6.34%
Mortgage Type
VA
Purchase Details
Closed on
Jul 31, 1996
Sold by
Felonk Robert
Bought by
Washington David L and Washington Claretha
Home Financials for this Owner
Home Financials are based on the most recent Mortgage that was taken out on this home.
Original Mortgage
$121,500
Interest Rate
8.47%
Mortgage Type
VA
Create a Home Valuation Report for This Property
The Home Valuation Report is an in-depth analysis detailing your home's value as well as a comparison with similar homes in the area
Home Values in the Area
Average Home Value in this Area
Purchase History
| Date | Buyer | Sale Price | Title Company |
|---|---|---|---|
| Mcarthur Latrice G | $96,000 | None Available | |
| Oliver Melvin C | $180,000 | Multiple | |
| Washington David L | $118,000 | -- |
Source: Public Records
Mortgage History
| Date | Status | Borrower | Loan Amount |
|---|---|---|---|
| Open | Mcarthur Latrice G | $93,566 | |
| Previous Owner | Oliver Melvin C | $183,857 | |
| Previous Owner | Washington David L | $121,500 |
Source: Public Records
Tax History Compared to Growth
Tax History
| Year | Tax Paid | Tax Assessment Tax Assessment Total Assessment is a certain percentage of the fair market value that is determined by local assessors to be the total taxable value of land and additions on the property. | Land | Improvement |
|---|---|---|---|---|
| 2024 | $3,546 | $21,000 | $2,325 | $18,675 |
| 2023 | $3,436 | $20,000 | $3,100 | $16,900 |
| 2022 | $3,436 | $20,000 | $3,100 | $16,900 |
| 2021 | $3,379 | $20,000 | $3,100 | $16,900 |
| 2020 | $2,367 | $13,637 | $3,100 | $10,537 |
| 2019 | $2,376 | $15,153 | $3,100 | $12,053 |
| 2018 | $2,335 | $15,153 | $3,100 | $12,053 |
| 2017 | $2,481 | $14,797 | $2,712 | $12,085 |
| 2016 | $2,486 | $14,797 | $2,712 | $12,085 |
| 2015 | $2,252 | $14,797 | $2,712 | $12,085 |
| 2014 | $2,221 | $14,421 | $2,518 | $11,903 |
| 2013 | $2,167 | $14,421 | $2,518 | $11,903 |
Source: Public Records
Map
Nearby Homes
- 8104 S Fairfield Ave
- 8026 S Fairfield Ave
- 8054 S Washtenaw Ave
- 8230 S Albany Ave
- 8242 S Albany Ave
- 3030 W 85th St
- 8053 S Kedzie Ave
- 8033 S Kedzie Ave
- 8223 S Sawyer Ave
- 3237 W 83rd Place
- 8033 S Campbell Ave
- 8118 S Spaulding Ave
- 2418 W 83rd St
- 8701 S Mozart Ave Unit P11
- 8701 S Mozart Ave Unit P10
- 2741 W 87th St
- 8701 S Sacramento Ave Unit 2NW
- 3011 W 87th St
- 7917 S Christiana Ave Unit 1
- 2321 W 81st Place
- 8232 S Mozart St
- 8226 S Mozart St
- 8236 S Mozart St
- 8222 S Mozart St
- 8238 S Mozart St
- 8220 S Mozart St
- 8216 S Mozart St
- 8242 S Mozart St
- 8242 S Mozart St
- 8229 S Francisco Ave
- 8227 S Francisco Ave
- 8233 S Francisco Ave
- 8223 S Francisco Ave
- 8237 S Francisco Ave
- 8246 S Mozart St
- 8212 S Mozart St
- 8221 S Francisco Ave
- 8239 S Francisco Ave
- 8227 S Mozart St
- 8217 S Francisco Ave