Estimated Value: $551,301 - $677,000
3
Beds
2
Baths
2,024
Sq Ft
$305/Sq Ft
Est. Value
About This Home
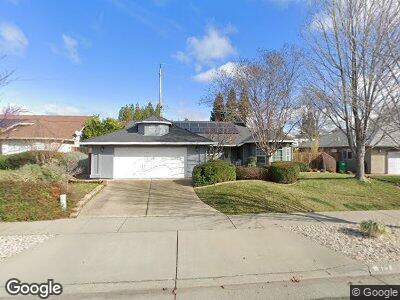
This home is located at 823 Coit Tower Way, Chico, CA 95928 and is currently estimated at $616,575, approximately $304 per square foot. 823 Coit Tower Way is a home located in Butte County with nearby schools including Parkview Elementary School, Harry M. Marsh Junior High School, and Chico High School.
Ownership History
Date
Name
Owned For
Owner Type
Purchase Details
Closed on
Jul 23, 2020
Sold by
Hammer Mark and Hammer Damiana
Bought by
Hammer Mark E and Hammer Damiana C
Current Estimated Value
Purchase Details
Closed on
Jul 14, 2015
Sold by
Hammer Mark and Hammer Damiana C
Bought by
Hammer Mark and Hammer Damiana C
Home Financials for this Owner
Home Financials are based on the most recent Mortgage that was taken out on this home.
Original Mortgage
$276,000
Outstanding Balance
$221,609
Interest Rate
4.01%
Mortgage Type
New Conventional
Estimated Equity
$397,903
Purchase Details
Closed on
Sep 19, 2001
Sold by
Mbd Inc
Bought by
Hammer Mark and Hammer Damiana
Home Financials for this Owner
Home Financials are based on the most recent Mortgage that was taken out on this home.
Original Mortgage
$46,748
Interest Rate
6.91%
Mortgage Type
Credit Line Revolving
Create a Home Valuation Report for This Property
The Home Valuation Report is an in-depth analysis detailing your home's value as well as a comparison with similar homes in the area
Home Values in the Area
Average Home Value in this Area
Purchase History
| Date | Buyer | Sale Price | Title Company |
|---|---|---|---|
| Hammer Mark E | -- | None Available | |
| Hammer Mark | -- | Placer Title Company | |
| Hammer Mark | $233,000 | Fidelity National Title |
Source: Public Records
Mortgage History
| Date | Status | Borrower | Loan Amount |
|---|---|---|---|
| Open | Hammer Mark | $50,000 | |
| Open | Hammer Mark | $276,000 | |
| Closed | Hammer Mark | $232,000 | |
| Closed | Hammer Mark | $100,000 | |
| Closed | Hammer Mark | $30,000 | |
| Closed | Hammer Mark | $260,000 | |
| Closed | Hammer Mark | $46,748 | |
| Closed | Hammer Mark | $186,252 |
Source: Public Records
Tax History Compared to Growth
Tax History
| Year | Tax Paid | Tax Assessment Tax Assessment Total Assessment is a certain percentage of the fair market value that is determined by local assessors to be the total taxable value of land and additions on the property. | Land | Improvement |
|---|---|---|---|---|
| 2024 | $4,698 | $337,152 | $98,476 | $238,676 |
| 2023 | $4,540 | $330,543 | $96,546 | $233,997 |
| 2022 | $4,232 | $324,062 | $94,653 | $229,409 |
| 2021 | $4,158 | $317,709 | $92,798 | $224,911 |
| 2020 | $4,111 | $314,452 | $91,847 | $222,605 |
| 2019 | $3,941 | $308,288 | $90,047 | $218,241 |
| 2018 | $3,643 | $302,244 | $88,282 | $213,962 |
| 2017 | $3,701 | $296,318 | $86,551 | $209,767 |
| 2016 | $3,382 | $290,508 | $84,854 | $205,654 |
| 2015 | $3,384 | $286,145 | $83,580 | $202,565 |
| 2014 | $3,316 | $280,541 | $81,943 | $198,598 |
Source: Public Records
Map
Nearby Homes
- 2376 Sausalito St
- 5 Catalina Point Rd
- 2875 Pennyroyal Dr Unit 46
- 2616 Lakewest Dr
- 11 Alameda Park Cir
- 2924 Pennyroyal Dr
- 1966 Vallombrosa Ave
- 2912 Pennyroyal Dr
- 2040 Vallombrosa Ave
- 292 Idyllwild Cir
- 3 Shalimar Ct
- 2695 Fairfield Common
- 491 Redwood Way
- 9 Arminta Ct
- 9 Coolwater Commons
- 0 Yosemite Dr
- 121 Wawona Place
- 6 Stansbury Ct
- 3014 California Park Dr
- 1675 Manzanita Ave Unit 88
- 823 Coit Tower Way
- 825 Coit Tower Way
- 827 Coit Tower Way
- 815 Coit Tower Way
- 2391 Burlingame Dr
- 831 Coit Tower Way
- 811 Coit Tower Way
- 2388 Bloomington Ave
- 2389 Bloomington Ave
- 820 Bruce Rd
- 2383 Burlingame Dr
- 835 Coit Tower Way
- 809 Coit Tower Way
- 2380 Bloomington Ave
- 2381 Bloomington Ave
- 832 Coit Tower Way
- 2398 Burlingame Dr
- 2375 Burlingame Dr
- 805 Coit Tower Way
- 2390 Burlingame Dr