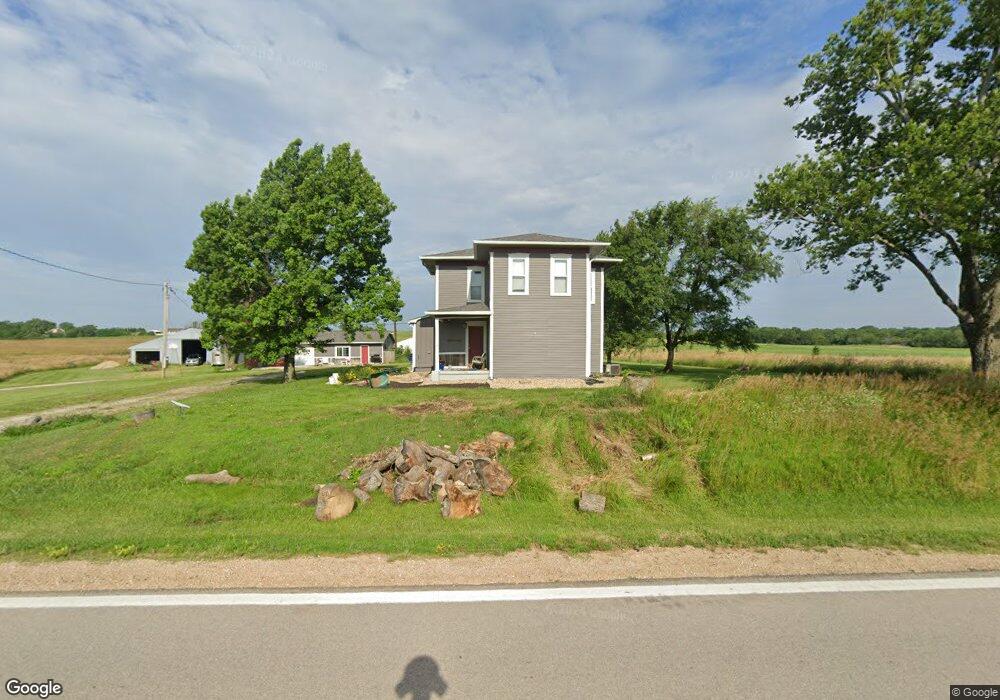
823 E 550th Rd Lawrence, KS 66047
Estimated Value: $405,000 - $778,000
3
Beds
2
Baths
2,109
Sq Ft
$295/Sq Ft
Est. Value
About This Home
This home is located at 823 E 550th Rd, Lawrence, KS 66047 and is currently estimated at $621,135, approximately $294 per square foot. 823 E 550th Rd is a home located in Douglas County with nearby schools including Billy Mills Middle School and Lawrence High School.
Ownership History
Date
Name
Owned For
Owner Type
Purchase Details
Closed on
Apr 18, 2014
Sold by
Hubbell Patrick S and Hubbell Kimberly G
Bought by
Harris Christopher W and Harris Imagene E
Current Estimated Value
Home Financials for this Owner
Home Financials are based on the most recent Mortgage that was taken out on this home.
Original Mortgage
$187,150
Interest Rate
4.38%
Mortgage Type
New Conventional
Purchase Details
Closed on
Mar 28, 2001
Sold by
Patchen Harold M and Patchen Sandra S
Bought by
Hubbell Patrick S and Hubbell Kimberly G
Home Financials for this Owner
Home Financials are based on the most recent Mortgage that was taken out on this home.
Original Mortgage
$110,000
Interest Rate
7%
Mortgage Type
Purchase Money Mortgage
Create a Home Valuation Report for This Property
The Home Valuation Report is an in-depth analysis detailing your home's value as well as a comparison with similar homes in the area
Purchase History
| Date | Buyer | Sale Price | Title Company |
|---|---|---|---|
| Harris Christopher W | -- | Continental Title Company | |
| Hubbell Patrick S | -- | First American Title |
Source: Public Records
Mortgage History
| Date | Status | Borrower | Loan Amount |
|---|---|---|---|
| Previous Owner | Harris Christopher W | $187,150 | |
| Previous Owner | Hubbell Patrick S | $110,000 |
Source: Public Records
Tax History
| Year | Tax Paid | Tax Assessment Tax Assessment Total Assessment is a certain percentage of the fair market value that is determined by local assessors to be the total taxable value of land and additions on the property. | Land | Improvement |
|---|---|---|---|---|
| 2025 | $5,202 | $43,053 | $4,940 | $38,113 |
| 2024 | $4,882 | $40,787 | $4,542 | $36,245 |
| 2023 | $4,629 | $36,897 | $4,457 | $32,440 |
| 2022 | $4,546 | $35,411 | $4,218 | $31,193 |
| 2021 | $3,962 | $30,623 | $4,156 | $26,467 |
| 2020 | $3,798 | $29,170 | $4,126 | $25,044 |
| 2019 | $3,618 | $27,856 | $4,035 | $23,821 |
| 2018 | $3,601 | $24,681 | $6,112 | $18,569 |
| 2017 | $3,369 | $24,628 | $6,112 | $18,516 |
| 2016 | $3,003 | $22,655 | $3,565 | $19,090 |
| 2015 | $3,035 | $22,655 | $3,565 | $19,090 |
| 2014 | $2,511 | $19,582 | $3,565 | $16,017 |
Source: Public Records
Map
Nearby Homes
- 623 N 900 Rd
- 374 N 750 Rd
- 587 N 615 Rd
- 537 E 550 Rd
- 0000 N 851 Diagonal Rd
- 11.77 Acres N 972 Rd
- 627 N 900 Rd
- 645 N 900 Rd
- 862 E 900 Rd
- 820 E 1000 Rd
- 144 N 1150 Rd
- 105 N 1250 Rd
- 0 Lot 4 33-14-18 N A Unit HMS2572348
- 110 N 1150 Rd
- 146 N 1150 Rd
- 134 N 1150 Rd
- 1298 E 250th Rd
- 20 Acres M/L E 350 Rd
- 1151 E 1135 Rd
- 1230 E 100 Rd
Your Personal Tour Guide
Ask me questions while you tour the home.