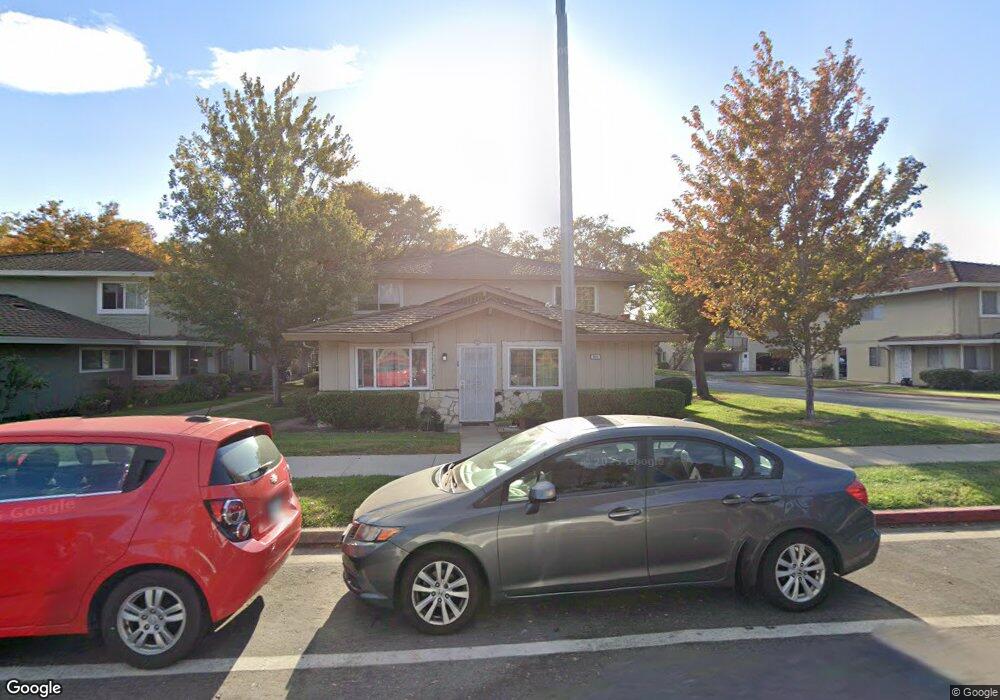
823 N Capitol Ave Unit 1 San Jose, CA 95133
Penitencia NeighborhoodEstimated Value: $463,335 - $540,000
2
Beds
1
Bath
810
Sq Ft
$635/Sq Ft
Est. Value
About This Home
This home is located at 823 N Capitol Ave Unit 1, San Jose, CA 95133 and is currently estimated at $514,334, approximately $634 per square foot. 823 N Capitol Ave Unit 1 is a home located in Santa Clara County with nearby schools including Summerdale Elementary School, Piedmont Middle School, and Independence High School.
Ownership History
Date
Name
Owned For
Owner Type
Purchase Details
Closed on
Nov 21, 2011
Sold by
Le Ngon N and Le Ngon Ngoc
Bought by
Le Ngon N and Tat Nga Y
Current Estimated Value
Home Financials for this Owner
Home Financials are based on the most recent Mortgage that was taken out on this home.
Original Mortgage
$140,000
Outstanding Balance
$14,194
Interest Rate
4.06%
Mortgage Type
New Conventional
Estimated Equity
$500,140
Purchase Details
Closed on
Jul 2, 2002
Sold by
Tat Calvin Tri Hao and Tat Julia Shean
Bought by
Le Ngon Ngoc and Ngo Vickie
Home Financials for this Owner
Home Financials are based on the most recent Mortgage that was taken out on this home.
Original Mortgage
$164,000
Interest Rate
6.78%
Mortgage Type
Stand Alone First
Purchase Details
Closed on
Apr 7, 1999
Sold by
Tat Calvin T and Chu Julia S
Bought by
Tat Calvin Tri Hao and Tat Julia Shean
Home Financials for this Owner
Home Financials are based on the most recent Mortgage that was taken out on this home.
Original Mortgage
$108,800
Interest Rate
6.91%
Mortgage Type
Stand Alone First
Create a Home Valuation Report for This Property
The Home Valuation Report is an in-depth analysis detailing your home's value as well as a comparison with similar homes in the area
Home Values in the Area
Average Home Value in this Area
Purchase History
| Date | Buyer | Sale Price | Title Company |
|---|---|---|---|
| Le Ngon N | -- | Chicago Title Company | |
| Le Ngon Ngoc | $205,000 | American Title Co | |
| Tat Calvin Tri Hao | -- | Financial Title Company |
Source: Public Records
Mortgage History
| Date | Status | Borrower | Loan Amount |
|---|---|---|---|
| Open | Le Ngon N | $140,000 | |
| Closed | Le Ngon Ngoc | $164,000 | |
| Previous Owner | Tat Calvin Tri Hao | $108,800 |
Source: Public Records
Tax History Compared to Growth
Tax History
| Year | Tax Paid | Tax Assessment Tax Assessment Total Assessment is a certain percentage of the fair market value that is determined by local assessors to be the total taxable value of land and additions on the property. | Land | Improvement |
|---|---|---|---|---|
| 2025 | $4,441 | $313,528 | $160,748 | $152,780 |
| 2024 | $4,441 | $307,382 | $157,597 | $149,785 |
| 2023 | $4,357 | $301,356 | $154,507 | $146,849 |
| 2022 | $4,351 | $295,448 | $151,478 | $143,970 |
| 2021 | $4,216 | $289,656 | $148,508 | $141,148 |
| 2020 | $4,118 | $286,687 | $146,986 | $139,701 |
| 2019 | $3,974 | $281,066 | $144,104 | $136,962 |
| 2018 | $3,922 | $275,556 | $141,279 | $134,277 |
| 2017 | $3,944 | $270,154 | $138,509 | $131,645 |
| 2016 | $3,773 | $264,858 | $135,794 | $129,064 |
| 2015 | $3,723 | $260,881 | $133,755 | $127,126 |
| 2014 | $3,532 | $255,771 | $131,135 | $124,636 |
Source: Public Records
Map
Nearby Homes
- 825 N Capitol Ave Unit 4
- 2714 Mabury Square
- 714 N Capitol Ave
- 674 Galleon Ct
- 985 Harcot Ct
- 990 Harcot Ct
- 981 Harcot Ct
- 997 Harcot Ct
- 994 Harcot Ct
- 982 Harcot Ct
- 970 E Harcot Ct
- 998 Harcot Ct
- 709 Whitewater Ct Unit 44
- Residence 2 Plan at Ascend
- Residence 1 Plan at Ascend
- Residence 3 Plan at Ascend
- 2806 Glauser Dr
- 633 Easton Dr
- 1055 N Capitol Ave Unit 124
- 1055 N Capitol Ave Unit 180
- 823 N Capitol Ave Unit 4
- 823 N Capitol Ave Unit 3
- 823 N Capitol Ave Unit 2
- 821 N Capitol Ave Unit 3
- 821 N Capitol Ave Unit 4
- 821 N Capitol Ave Unit 3
- 821 N Capitol Ave Unit 2
- 821 N Capitol Ave Unit 1
- 825 N Capitol Ave Unit 3
- 825 N Capitol Ave Unit 2
- 825 N Capitol Ave Unit 1
- 862 Gilchrist Dr Unit 3
- 862 Gilchrist Walkway Unit 3
- 862 Gilchrist Walkway Unit 2
- 862 Gilchrist Walkway Unit 4
- 862 Gilchrist Walkway Unit 1
- 819 N Capitol Ave Unit 4
- 819 N Capitol Ave Unit 3
- 819 N Capitol Ave Unit 2
- 819 N Capitol Ave Unit 1