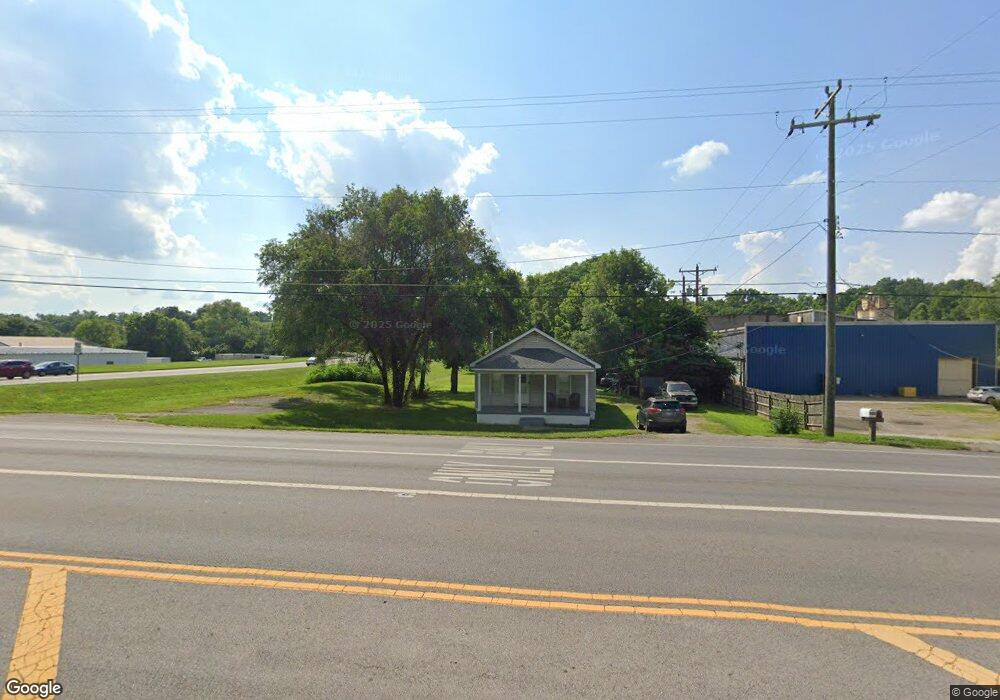
823 N Main St Franklin, OH 45005
Estimated Value: $130,000 - $176,000
2
Beds
1
Bath
816
Sq Ft
$185/Sq Ft
Est. Value
About This Home
This home is located at 823 N Main St, Franklin, OH 45005 and is currently estimated at $151,188, approximately $185 per square foot. 823 N Main St is a home located in Warren County with nearby schools including Franklin High School.
Ownership History
Date
Name
Owned For
Owner Type
Purchase Details
Closed on
Nov 2, 2014
Sold by
Estate Of Richard W Bowlin
Bought by
Bowlin William
Current Estimated Value
Purchase Details
Closed on
May 20, 1988
Sold by
Bowlin Bowlin and Bowlin Richard W
Bought by
Bowlin Bowlin and Bowlin Richard W
Purchase Details
Closed on
Feb 8, 1988
Sold by
Bowlin Bowlin and Bowlin John C
Bought by
Bowlin Bowlin and Bowlin Richard W
Purchase Details
Closed on
Nov 8, 1978
Sold by
Bowlin Bowlin and Bowlin John C
Purchase Details
Closed on
Oct 19, 1978
Sold by
Bowlin Bowlin and Bowlin Shirley M
Create a Home Valuation Report for This Property
The Home Valuation Report is an in-depth analysis detailing your home's value as well as a comparison with similar homes in the area
Home Values in the Area
Average Home Value in this Area
Purchase History
| Date | Buyer | Sale Price | Title Company |
|---|---|---|---|
| Bowlin William | -- | None Available | |
| Bowlin Bowlin | -- | -- | |
| Bowlin Bowlin | -- | -- | |
| -- | -- | -- | |
| -- | -- | -- |
Source: Public Records
Tax History Compared to Growth
Tax History
| Year | Tax Paid | Tax Assessment Tax Assessment Total Assessment is a certain percentage of the fair market value that is determined by local assessors to be the total taxable value of land and additions on the property. | Land | Improvement |
|---|---|---|---|---|
| 2024 | $1,736 | $35,540 | $15,340 | $20,200 |
| 2023 | $1,366 | $25,231 | $8,701 | $16,530 |
| 2022 | $1,340 | $25,232 | $8,701 | $16,531 |
| 2021 | $1,268 | $25,232 | $8,701 | $16,531 |
| 2020 | $1,145 | $20,024 | $6,906 | $13,118 |
| 2019 | $1,045 | $20,024 | $6,906 | $13,118 |
| 2018 | $1,018 | $20,024 | $6,906 | $13,118 |
| 2017 | $1,083 | $18,984 | $6,633 | $12,352 |
| 2016 | $1,104 | $18,984 | $6,633 | $12,352 |
| 2015 | $1,113 | $18,984 | $6,633 | $12,352 |
| 2014 | $1,132 | $18,980 | $6,630 | $12,350 |
| 2013 | $953 | $21,960 | $7,670 | $14,290 |
Source: Public Records
Map
Nearby Homes
- 121 Boys Ave
- 1012 Gribble Dr
- 324 Cris Ct
- 209 Rossman Ct
- 102 Warren Ave
- 212 Rossman Ct
- 315 Bridge St
- 0 Victoria Dr Unit 942075
- 0 Victoria Dr Unit 1852824
- 228 Bridge St
- 42 N River St
- 56 Skokiaan Dr
- 520 Arlington Ave
- 104 Mound Builder Place
- 413 Spring Ave
- 551 E 2nd St
- 5575 Fairview Dr
- 122 Fairview Dr
- 605 Spring Ave
- 821 Arlington Ave