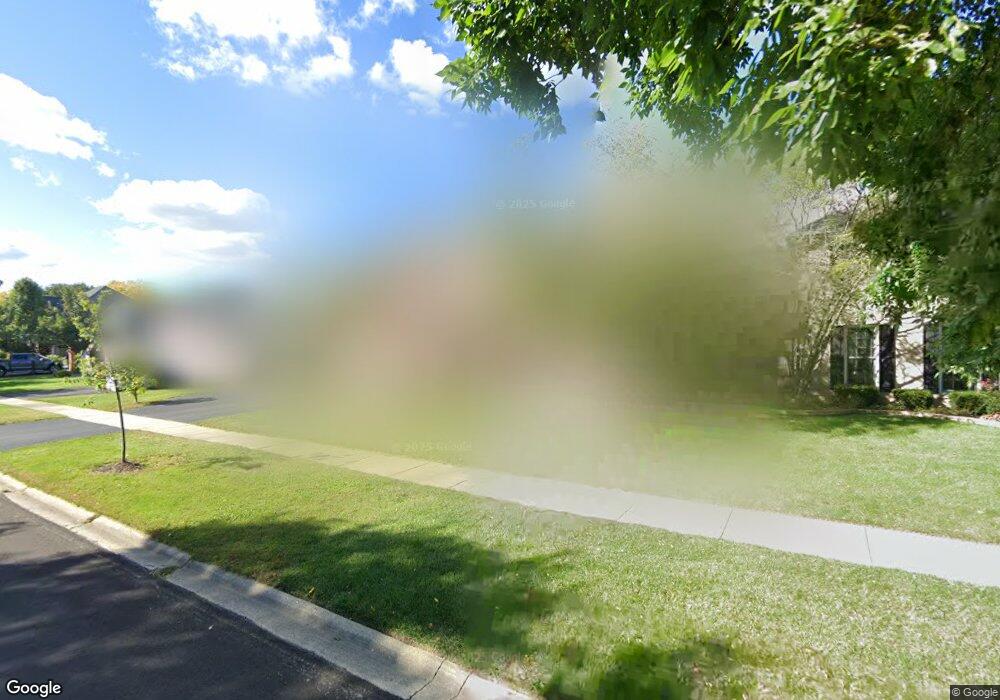
823 Rock Spring Rd Naperville, IL 60565
Springbrook Prairie NeighborhoodEstimated Value: $755,431 - $834,000
4
Beds
3
Baths
3,151
Sq Ft
$255/Sq Ft
Est. Value
About This Home
This home is located at 823 Rock Spring Rd, Naperville, IL 60565 and is currently estimated at $802,358, approximately $254 per square foot. 823 Rock Spring Rd is a home located in Will County with nearby schools including Spring Brook Elementary School, Gordon Gregory Middle School, and Neuqua Valley High School.
Ownership History
Date
Name
Owned For
Owner Type
Purchase Details
Closed on
Mar 26, 2004
Sold by
Finck Christopher H and Finck Susan L
Bought by
Schwebe Armin and Schwebe Katherine E
Current Estimated Value
Home Financials for this Owner
Home Financials are based on the most recent Mortgage that was taken out on this home.
Original Mortgage
$333,700
Outstanding Balance
$156,926
Interest Rate
5.65%
Mortgage Type
Purchase Money Mortgage
Estimated Equity
$645,432
Purchase Details
Closed on
Feb 25, 1998
Sold by
Vucovich E Daniel and Vucovich Suzanne S
Bought by
Vucovich Suzanne S and Vucovich Daniel E
Home Financials for this Owner
Home Financials are based on the most recent Mortgage that was taken out on this home.
Original Mortgage
$338,000
Interest Rate
6.87%
Create a Home Valuation Report for This Property
The Home Valuation Report is an in-depth analysis detailing your home's value as well as a comparison with similar homes in the area
Home Values in the Area
Average Home Value in this Area
Purchase History
| Date | Buyer | Sale Price | Title Company |
|---|---|---|---|
| Schwebe Armin | $490,000 | Midwest Title Services Llc | |
| Vucovich Suzanne S | -- | -- | |
| Vucovich E Daniel | $338,000 | Chicago Title Insurance Co |
Source: Public Records
Mortgage History
| Date | Status | Borrower | Loan Amount |
|---|---|---|---|
| Open | Schwebe Armin | $333,700 | |
| Previous Owner | Vucovich E Daniel | $338,000 |
Source: Public Records
Tax History
| Year | Tax Paid | Tax Assessment Tax Assessment Total Assessment is a certain percentage of the fair market value that is determined by local assessors to be the total taxable value of land and additions on the property. | Land | Improvement |
|---|---|---|---|---|
| 2024 | $14,099 | $223,258 | $57,627 | $165,631 |
| 2023 | $14,099 | $197,224 | $50,907 | $146,317 |
| 2022 | $13,031 | $185,855 | $48,157 | $137,698 |
| 2021 | $12,456 | $177,005 | $45,864 | $131,141 |
| 2020 | $12,220 | $174,200 | $45,137 | $129,063 |
| 2019 | $12,011 | $169,291 | $43,865 | $125,426 |
| 2018 | $11,988 | $166,038 | $42,901 | $123,137 |
| 2017 | $11,806 | $161,751 | $41,793 | $119,958 |
| 2016 | $11,785 | $158,269 | $40,893 | $117,376 |
| 2015 | $11,976 | $152,182 | $39,320 | $112,862 |
| 2014 | $11,976 | $149,207 | $39,320 | $109,887 |
| 2013 | $11,976 | $149,207 | $39,320 | $109,887 |
Source: Public Records
Map
Nearby Homes
- 911 Rock Spring Rd
- 10S144 Ridge Rd
- 599 Hempstead Ave
- 1137 Crimson Ct
- 2347 Wilmington Ct
- 2711 Wendy Dr
- 2715 Wendy Dr
- 2627 Homestead Dr
- 1321 Galena Ct
- 2240 Mecan Dr
- 484 Blodgett Ct
- 2726 Seiler Dr Unit 2
- 28W555 Leverenz Rd
- 2308 Modaff Rd
- 2802 Wedgewood Dr
- 28W587 Leverenz Rd
- 352 Danbury Dr
- 364 Avena Cir
- 2049 Dorval Dr
- 719 Eagle Brook Ln Unit 4
- 903 Rock Spring Rd
- 819 Rock Spring Rd
- 27W583 Meadow Rd
- 815 Rock Spring Rd
- 907 Rock Spring Rd
- 824 Rock Spring Rd
- 27W599 Meadow Dr
- 820 Rock Spring Rd
- 2303 Boulder Ct
- 811 Rock Spring Rd
- 816 Rock Spring Rd
- 908 Rock Spring Rd
- 2308 Boulder Ct
- 915 Rock Spring Rd
- 807 Rock Spring Rd
- 2307 Boulder Ct
- 27W567 Meadow Dr
- 10S216 Springbrook Dr
- 812 Rock Spring Rd
- 10S223 Ridge Rd
Your Personal Tour Guide
Ask me questions while you tour the home.