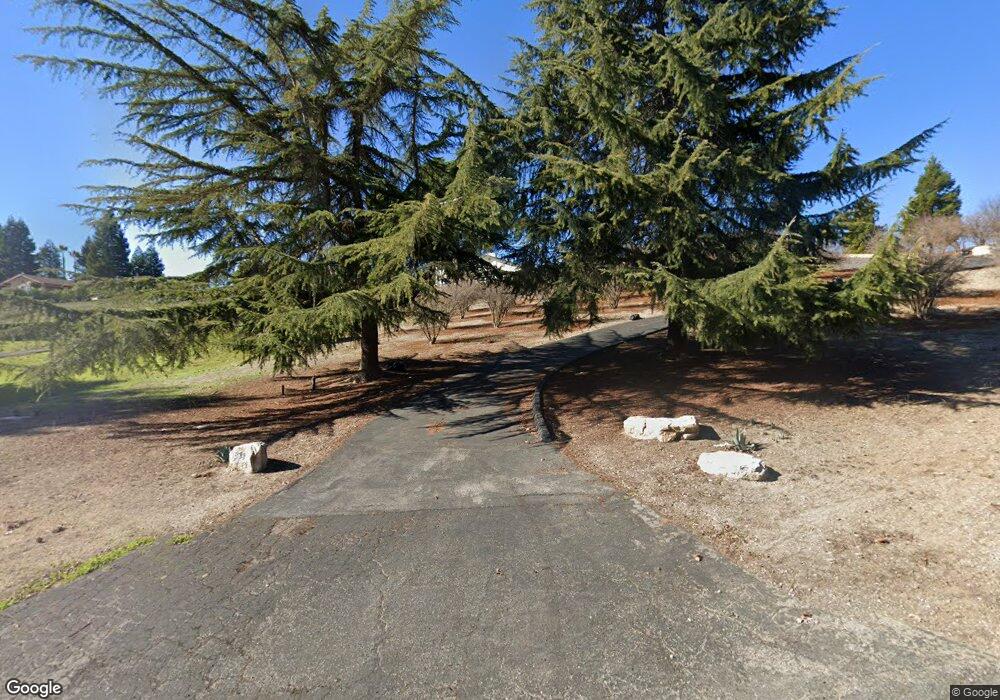
823 Rolling Hills Rd Paso Robles, CA 93446
Estimated Value: $1,007,000 - $1,173,000
4
Beds
3
Baths
2,800
Sq Ft
$400/Sq Ft
Est. Value
About This Home
This home is located at 823 Rolling Hills Rd, Paso Robles, CA 93446 and is currently estimated at $1,121,143, approximately $400 per square foot. 823 Rolling Hills Rd is a home located in San Luis Obispo County with nearby schools including Winifred Pifer Elementary School, Daniel Lewis Middle School, and Paso Robles High School.
Ownership History
Date
Name
Owned For
Owner Type
Purchase Details
Closed on
Nov 13, 2016
Sold by
Martin Malia
Bought by
Martin Oris T and Martin Malia L
Current Estimated Value
Purchase Details
Closed on
Aug 17, 2006
Sold by
Martin Oris T
Bought by
Martin Malia
Home Financials for this Owner
Home Financials are based on the most recent Mortgage that was taken out on this home.
Original Mortgage
$624,800
Outstanding Balance
$526,536
Interest Rate
7.87%
Mortgage Type
New Conventional
Estimated Equity
$594,607
Purchase Details
Closed on
Apr 15, 2004
Sold by
Willett Kenneth D and Willett Denise M
Bought by
Martin Oris T and Martin Malia L
Home Financials for this Owner
Home Financials are based on the most recent Mortgage that was taken out on this home.
Original Mortgage
$405,750
Interest Rate
4.97%
Mortgage Type
Unknown
Purchase Details
Closed on
Nov 3, 1997
Sold by
Willett Kenneth Dee and Willett Denise Marie
Bought by
Willett Kenneth D and Willett Denise M
Create a Home Valuation Report for This Property
The Home Valuation Report is an in-depth analysis detailing your home's value as well as a comparison with similar homes in the area
Purchase History
| Date | Buyer | Sale Price | Title Company |
|---|---|---|---|
| Martin Oris T | -- | None Available | |
| Martin Malia | -- | First American Title | |
| Martin Oris T | $541,000 | First American Title Company | |
| Willett Kenneth D | -- | -- | |
| Willett Kenneth D | -- | -- |
Source: Public Records
Mortgage History
| Date | Status | Borrower | Loan Amount |
|---|---|---|---|
| Open | Martin Malia | $624,800 | |
| Closed | Martin Oris T | $405,750 |
Source: Public Records
Tax History
| Year | Tax Paid | Tax Assessment Tax Assessment Total Assessment is a certain percentage of the fair market value that is determined by local assessors to be the total taxable value of land and additions on the property. | Land | Improvement |
|---|---|---|---|---|
| 2025 | $8,306 | $769,170 | $341,219 | $427,951 |
| 2024 | $8,169 | $754,089 | $334,529 | $419,560 |
| 2023 | $8,169 | $739,304 | $327,970 | $411,334 |
| 2022 | $8,046 | $724,809 | $321,540 | $403,269 |
| 2021 | $7,907 | $710,598 | $315,236 | $395,362 |
| 2020 | $7,799 | $703,313 | $312,004 | $391,309 |
| 2019 | $7,686 | $689,524 | $305,887 | $383,637 |
| 2018 | $7,580 | $676,005 | $299,890 | $376,115 |
| 2017 | $7,126 | $662,751 | $294,010 | $368,741 |
| 2016 | $6,890 | $641,000 | $285,000 | $356,000 |
| 2015 | $6,463 | $595,000 | $265,000 | $330,000 |
| 2014 | $6,363 | $595,000 | $265,000 | $330,000 |
Source: Public Records
Map
Nearby Homes
- 843 Hacienda Cir
- 1766 Union Rd
- 1555 Lyle Ln
- 2039 Promontory Place
- 845 Creston Rd
- 2450 Golden Hill Rd
- 2104 Summit Dr
- 621 Jackson Dr
- 1639 Kleck Rd
- 616 Jackson Dr
- 714 Tanner Dr Unit A6
- 714 Tanner Dr Unit 6A
- 629 Trigo Ln
- 1212 Mariah Ln
- 507 Grand Canyon Dr
- 509 Grand Canyon Dr
- 1107 Patricia Ln
- 2050 Prospect Ave
- 301 Oak Meadow Ln
- 291 Quail Summit
- 819 Rolling Hills Rd
- 942 Osos Way
- 815 Rolling Hills Rd
- 1029 Vista Grande St
- 1031 Vista Grande St
- 849 Rolling Hills Rd
- 747 Rolling Hills Rd
- 745 Rolling Hills Rd
- 809 Rolling Hills Rd
- 1033 Vista Grande St
- 901 Rolling Hills Rd
- 1025 Vista Grande St
- 936 Osos Way
- 817 Hacienda Cir
- 805 Rolling Hills Rd
- 1035 Vista Grande St
- 815 Hacienda Cir
- 1024 Vista Grande St
- 819 Hacienda Cir
- 932 Osos Way
Your Personal Tour Guide
Ask me questions while you tour the home.