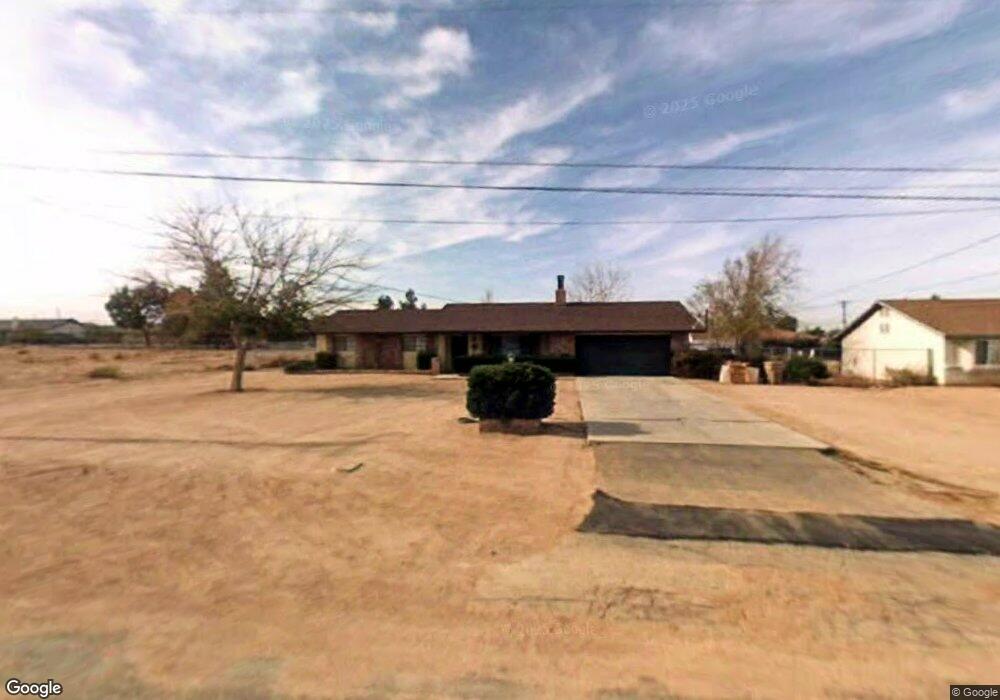
8234 Durango Ave Hesperia, CA 92345
The Mesa NeighborhoodEstimated Value: $414,997 - $478,000
3
Beds
2
Baths
1,569
Sq Ft
$279/Sq Ft
Est. Value
About This Home
This home is located at 8234 Durango Ave, Hesperia, CA 92345 and is currently estimated at $438,499, approximately $279 per square foot. 8234 Durango Ave is a home located in San Bernardino County with nearby schools including Kingston Elementary School, Ranchero Middle School, and Sultana High School.
Ownership History
Date
Name
Owned For
Owner Type
Purchase Details
Closed on
Mar 15, 2016
Sold by
Anderson Devanie
Bought by
Anderson Griego Devanie and Griego Raymond
Current Estimated Value
Purchase Details
Closed on
Nov 30, 2009
Sold by
The Secretary Of Housing & Urban Develop
Bought by
Anderson Devanie
Home Financials for this Owner
Home Financials are based on the most recent Mortgage that was taken out on this home.
Original Mortgage
$112,294
Interest Rate
4.99%
Mortgage Type
FHA
Purchase Details
Closed on
Jul 22, 2009
Sold by
Wells Fargo Bank Na
Bought by
The Secretary Of Housing & Urban Develop
Purchase Details
Closed on
Jun 18, 2009
Sold by
Aguilar Benjamin Lopez
Bought by
Wells Fargo Bank Na
Purchase Details
Closed on
Dec 26, 2005
Sold by
Schueman Ernest L
Bought by
Aguilar Benjamin Lopez and Aguilar Maria
Home Financials for this Owner
Home Financials are based on the most recent Mortgage that was taken out on this home.
Original Mortgage
$314,556
Interest Rate
6.28%
Mortgage Type
FHA
Create a Home Valuation Report for This Property
The Home Valuation Report is an in-depth analysis detailing your home's value as well as a comparison with similar homes in the area
Home Values in the Area
Average Home Value in this Area
Purchase History
| Date | Buyer | Sale Price | Title Company |
|---|---|---|---|
| Anderson Griego Devanie | -- | Accommodation | |
| Anderson Devanie | $105,500 | Stewart Title Company | |
| The Secretary Of Housing & Urban Develop | -- | First American Title Company | |
| Wells Fargo Bank Na | $327,676 | Accommodation | |
| Aguilar Benjamin Lopez | $319,000 | Chicago Title Co |
Source: Public Records
Mortgage History
| Date | Status | Borrower | Loan Amount |
|---|---|---|---|
| Previous Owner | Anderson Devanie | $112,294 | |
| Previous Owner | Aguilar Benjamin Lopez | $314,556 |
Source: Public Records
Tax History
| Year | Tax Paid | Tax Assessment Tax Assessment Total Assessment is a certain percentage of the fair market value that is determined by local assessors to be the total taxable value of land and additions on the property. | Land | Improvement |
|---|---|---|---|---|
| 2025 | $1,724 | $151,801 | $25,818 | $125,983 |
| 2024 | $1,686 | $148,825 | $25,312 | $123,513 |
| 2023 | $1,668 | $145,907 | $24,816 | $121,091 |
| 2022 | $1,630 | $143,046 | $24,329 | $118,717 |
| 2021 | $1,601 | $140,241 | $23,852 | $116,389 |
| 2020 | $1,429 | $124,523 | $23,607 | $100,916 |
| 2019 | $1,400 | $122,081 | $23,144 | $98,937 |
| 2018 | $1,374 | $119,687 | $22,690 | $96,997 |
| 2017 | $1,350 | $117,340 | $22,245 | $95,095 |
| 2016 | $1,323 | $115,039 | $21,809 | $93,230 |
| 2015 | $1,306 | $113,311 | $21,481 | $91,830 |
| 2014 | $1,289 | $111,091 | $21,060 | $90,031 |
Source: Public Records
Map
Nearby Homes
- 18236 Danbury Ave
- 0 Yuba St
- 18401 Westlawn St
- 18502 Danbury Ave
- 18507 Westlawn St
- 18102 Hinton St
- 18539 Yuba St
- 18540 Seaforth St
- 18525 Seaforth St
- 17995 Seaforth St
- 7762 Madera Ave
- 18126 Fairburn St
- 18540 Fairburn St
- 0 Whisper Ln Unit IV25244814
- 7946 Gaylop Ave
- 18596 Fairburn St
- 7721 Langdon Ave
- 18724 Danbury Ave
- 17850 Bangor Ave
- 18393 Orange St
- 8250 Durango Ave
- 0 Durango Ave
- 8221 Pismo Ave
- 8204 Durango Ave
- 8205 Pismo Ave
- 18255 Preston St
- 8237 Durango Ave
- 8243 Durango Ave
- 18261 Preston St
- 8255 Durango Ave
- 8195 Pismo Ave
- 8221 Durango Ave
- 8207 Durango Ave
- 8181 Pismo Ave
- 8190 Durango Ave
- 18250 Preston St
- 18236 Preston St
- 18266 Preston St
- 8195 Durango Ave
Your Personal Tour Guide
Ask me questions while you tour the home.