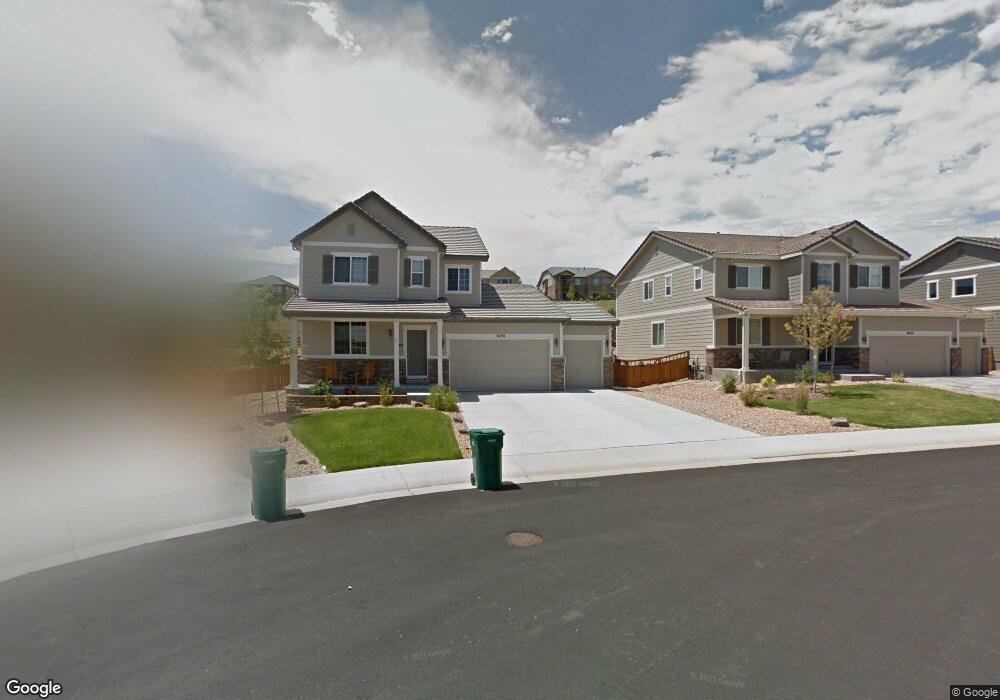
8239 El Jebel Loop Castle Rock, CO 80108
Cobblestone Ranch NeighborhoodEstimated Value: $599,000 - $739,000
3
Beds
3
Baths
3,306
Sq Ft
$196/Sq Ft
Est. Value
About This Home
This home is located at 8239 El Jebel Loop, Castle Rock, CO 80108 and is currently estimated at $648,399, approximately $196 per square foot. 8239 El Jebel Loop is a home located in Douglas County with nearby schools including Franktown Elementary School, Sagewood Middle School, and Ponderosa High School.
Ownership History
Date
Name
Owned For
Owner Type
Purchase Details
Closed on
May 15, 2018
Sold by
Root Jeffrey and Root Hope
Bought by
Trask Jason and Trask Jaqueline
Current Estimated Value
Home Financials for this Owner
Home Financials are based on the most recent Mortgage that was taken out on this home.
Original Mortgage
$396,000
Outstanding Balance
$338,763
Interest Rate
4.4%
Mortgage Type
New Conventional
Estimated Equity
$309,636
Purchase Details
Closed on
Feb 26, 2010
Sold by
Richmond American Homes Of Colorado Inc
Bought by
Root Jeffrey and Root Hope
Home Financials for this Owner
Home Financials are based on the most recent Mortgage that was taken out on this home.
Original Mortgage
$283,732
Interest Rate
4.75%
Mortgage Type
FHA
Purchase Details
Closed on
Feb 4, 2010
Sold by
Mdc Land Corp
Bought by
Richmond American Homes Of Colorado Inc
Home Financials for this Owner
Home Financials are based on the most recent Mortgage that was taken out on this home.
Original Mortgage
$283,732
Interest Rate
4.75%
Mortgage Type
FHA
Create a Home Valuation Report for This Property
The Home Valuation Report is an in-depth analysis detailing your home's value as well as a comparison with similar homes in the area
Home Values in the Area
Average Home Value in this Area
Purchase History
| Date | Buyer | Sale Price | Title Company |
|---|---|---|---|
| Trask Jason | $440,000 | Colorado Escrow & Title | |
| Root Jeffrey | $288,900 | American Home Title & Escrow | |
| Richmond American Homes Of Colorado Inc | -- | -- |
Source: Public Records
Mortgage History
| Date | Status | Borrower | Loan Amount |
|---|---|---|---|
| Open | Trask Jason | $396,000 | |
| Previous Owner | Root Jeffrey | $283,732 |
Source: Public Records
Tax History
| Year | Tax Paid | Tax Assessment Tax Assessment Total Assessment is a certain percentage of the fair market value that is determined by local assessors to be the total taxable value of land and additions on the property. | Land | Improvement |
|---|---|---|---|---|
| 2025 | $6,090 | $39,540 | $12,120 | $27,420 |
| 2024 | $6,090 | $45,230 | $11,040 | $34,190 |
| 2023 | $6,129 | $45,230 | $11,040 | $34,190 |
| 2022 | $4,492 | $32,290 | $7,910 | $24,380 |
| 2021 | $4,605 | $32,290 | $7,910 | $24,380 |
| 2020 | $4,523 | $31,140 | $7,660 | $23,480 |
| 2019 | $4,533 | $31,140 | $7,660 | $23,480 |
| 2018 | $4,089 | $27,840 | $6,500 | $21,340 |
| 2017 | $3,923 | $27,840 | $6,500 | $21,340 |
| 2016 | $3,548 | $26,030 | $6,490 | $19,540 |
| 2015 | $3,690 | $26,030 | $6,490 | $19,540 |
| 2014 | $3,376 | $23,400 | $5,950 | $17,450 |
Source: Public Records
Map
Nearby Homes
- 6558 San Miguel Ct
- 8148 Grady Cir
- 6596 Lynch Ln
- 7312 Grady Cir
- 7870 Sabino Ln
- 7418 Grady Cir
- 7916 Grady Cir
- 7287 Greenwater Cir
- 7757 Blue Water Ln
- 7408 Greenwater Cir
- 7791 Grady Cir
- 7315 Blue Water Dr
- 7516 Oasis Dr
- 5725 Pleasant View Dr
- 7718 Greenwater Cir
- 4735 Desperado Way
- 5923 Bridle Path Ln
- 7005 Leilani Dr
- 4815 Desperado Way
- 6866 Petunia Place
- 8225 El Jebel Loop
- 8251 El Jebel Loop
- 8211 El Jebel Loop
- 8255 El Jebel Loop
- 8256 El Jebel Loop
- 8269 El Jebel Loop
- 8199 El Jebel Loop
- 8278 El Jebel Loop
- 8139 Grady Cir
- 8281 El Jebel Loop
- 8143 Grady Cir
- 8135 Grady Cir
- 8290 El Jebel Loop
- 8155 Grady Cir
- 6506 San Miguel Ct
- 8158 El Jebel Loop
- 6532 San Miguel Ct
- 6478 San Miguel Ct
- 6452 San Miguel Ct
- 8144 El Jebel Loop
Your Personal Tour Guide
Ask me questions while you tour the home.