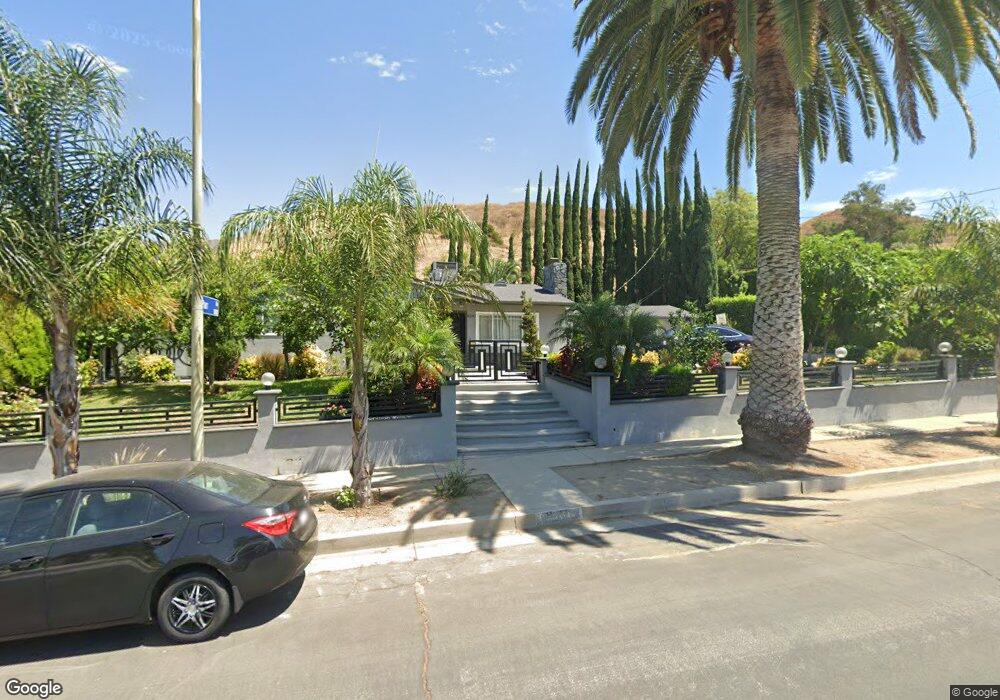
8239 Ellenbogen St Sunland, CA 91040
Sunland NeighborhoodEstimated Value: $1,014,000 - $1,092,597
3
Beds
2
Baths
1,290
Sq Ft
$807/Sq Ft
Est. Value
About This Home
This home is located at 8239 Ellenbogen St, Sunland, CA 91040 and is currently estimated at $1,041,649, approximately $807 per square foot. 8239 Ellenbogen St is a home located in Los Angeles County with nearby schools including Sunland Elementary School, Mt. Gleason Middle School, and Verdugo Hills Senior High School.
Ownership History
Date
Name
Owned For
Owner Type
Purchase Details
Closed on
Apr 6, 2020
Sold by
Silveri Joseph A and Silveri Karen L
Bought by
Silveri Joseph A and Silveri Karen L
Current Estimated Value
Purchase Details
Closed on
Aug 18, 1999
Sold by
Wikoff Betty J
Bought by
Silveri Joseph A and Silveri Karen L
Home Financials for this Owner
Home Financials are based on the most recent Mortgage that was taken out on this home.
Original Mortgage
$120,000
Interest Rate
7.77%
Create a Home Valuation Report for This Property
The Home Valuation Report is an in-depth analysis detailing your home's value as well as a comparison with similar homes in the area
Home Values in the Area
Average Home Value in this Area
Purchase History
| Date | Buyer | Sale Price | Title Company |
|---|---|---|---|
| Silveri Joseph A | -- | None Available | |
| Silveri Joseph A | $208,000 | Southland Title Corporation |
Source: Public Records
Mortgage History
| Date | Status | Borrower | Loan Amount |
|---|---|---|---|
| Previous Owner | Silveri Joseph A | $120,000 |
Source: Public Records
Tax History
| Year | Tax Paid | Tax Assessment Tax Assessment Total Assessment is a certain percentage of the fair market value that is determined by local assessors to be the total taxable value of land and additions on the property. | Land | Improvement |
|---|---|---|---|---|
| 2025 | $4,663 | $365,942 | $205,635 | $160,307 |
| 2024 | $4,663 | $358,767 | $201,603 | $157,164 |
| 2023 | $4,578 | $351,733 | $197,650 | $154,083 |
| 2022 | $4,374 | $344,837 | $193,775 | $151,062 |
| 2021 | $4,315 | $338,076 | $189,976 | $148,100 |
| 2019 | $4,191 | $328,051 | $184,343 | $143,708 |
| 2018 | $4,049 | $321,620 | $180,729 | $140,891 |
| 2016 | $3,858 | $309,133 | $173,712 | $135,421 |
| 2015 | $3,804 | $304,490 | $171,103 | $133,387 |
| 2014 | $3,829 | $298,527 | $167,752 | $130,775 |
Source: Public Records
Map
Nearby Homes
- 11159 Mcvine Ave
- 11034 Scoville Ave
- 11020 Scoville Ave
- 12159 Oro Vista Ave
- 11019 Nassau Ave
- 8110 Brownstone St
- 8001 Denivelle Rd
- 0 Alethea Dr
- 11395 Oro Vista Ave
- 10823 Parr Ave
- 8545 Tujunga Valley St
- 11014 Leolang Ave
- 11020 Whitegate Ave
- 8230 Kyle St
- 7941 Wentworth St
- 8633 Le Berthon St
- 7815 Denivelle Rd
- 7848 Forsythe St
- 7853 Jayseel St
- 10799 Sherman Grove Ave Unit 82
- 8241 Ellenbogen St
- 8253 Ellenbogen St
- 8240 Ellenbogen St
- 11138 Parr Ave
- 11135 Odell Ave
- 11141 Mcvine Ave
- 11134 Parr Ave
- 11143 Parr Ave
- 11129 Odell Ave
- 11132 Odell Ave
- 11137 Parr Ave
- 11128 Parr Ave
- 11119 Odell Ave
- 11123 Odell Ave
- 8268 Ellenbogen St
- 11126 Odell Ave
- 11131 Parr Ave
- 11131 Mcvine Ave
- 8269 Ellenbogen St
Your Personal Tour Guide
Ask me questions while you tour the home.