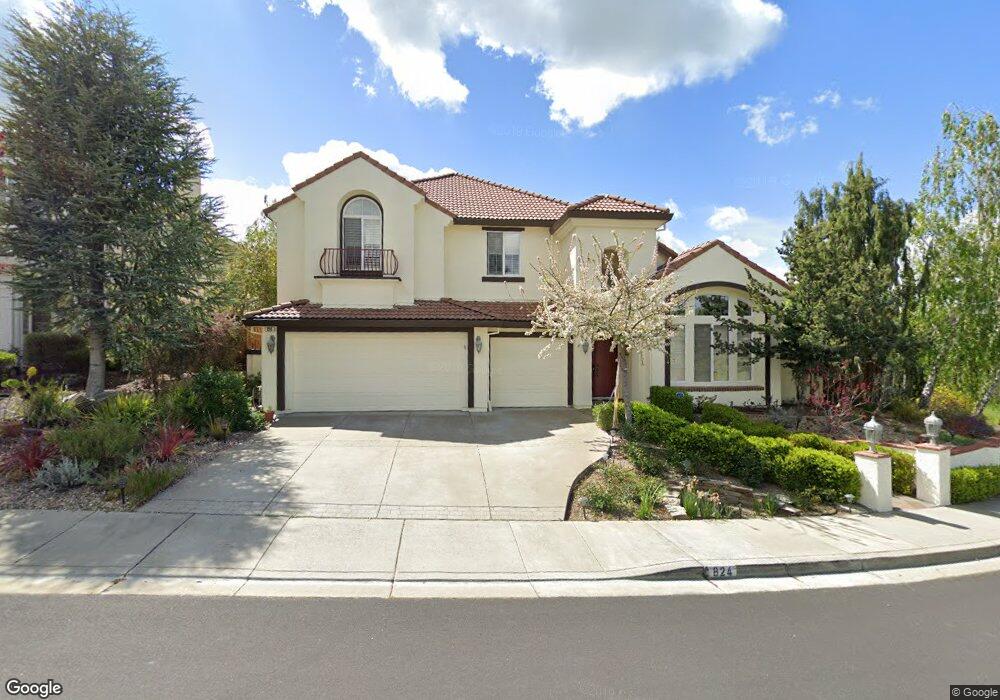
824 Deer Spring Cir Concord, CA 94521
The Highlands NeighborhoodEstimated Value: $1,385,775 - $1,508,000
4
Beds
4
Baths
3,072
Sq Ft
$468/Sq Ft
Est. Value
About This Home
This home is located at 824 Deer Spring Cir, Concord, CA 94521 and is currently estimated at $1,436,194, approximately $467 per square foot. 824 Deer Spring Cir is a home located in Contra Costa County with nearby schools including Highlands Elementary School, Mt. Diablo Elementary School, and Pine Hollow Middle School.
Ownership History
Date
Name
Owned For
Owner Type
Purchase Details
Closed on
Jan 12, 2021
Sold by
Tselenchuk Igor and Tselenchuk Erin
Bought by
Tselenchuk Igor and Tselenchuk Erin Kathleen
Current Estimated Value
Home Financials for this Owner
Home Financials are based on the most recent Mortgage that was taken out on this home.
Original Mortgage
$390,564
Outstanding Balance
$285,567
Interest Rate
2.71%
Mortgage Type
New Conventional
Estimated Equity
$1,150,627
Purchase Details
Closed on
Jan 8, 2014
Sold by
Tselenchuk Igor and Tselenchuk Erin K
Bought by
The Igor & Erin Tselenchuk 2014 Living T
Purchase Details
Closed on
Jan 9, 2013
Sold by
Hatfield Gary L and Hatfield Rebecca
Bought by
Tselenckuk Igor and Tselenckuk Erin K
Home Financials for this Owner
Home Financials are based on the most recent Mortgage that was taken out on this home.
Original Mortgage
$540,000
Interest Rate
3.31%
Mortgage Type
New Conventional
Purchase Details
Closed on
Aug 3, 2005
Sold by
Hatfield Gary L
Bought by
Hatfield Gary L and Allred Rebecca
Home Financials for this Owner
Home Financials are based on the most recent Mortgage that was taken out on this home.
Original Mortgage
$826,400
Interest Rate
5.72%
Mortgage Type
Fannie Mae Freddie Mac
Purchase Details
Closed on
Jun 21, 2005
Sold by
Miller Donald E
Bought by
Hatfield Gary L
Home Financials for this Owner
Home Financials are based on the most recent Mortgage that was taken out on this home.
Original Mortgage
$826,400
Interest Rate
5.72%
Mortgage Type
Fannie Mae Freddie Mac
Purchase Details
Closed on
Jul 13, 2004
Sold by
Sweeney Richard T and Miller Donald E
Bought by
Miller Donald E and Sweeney Richard T
Home Financials for this Owner
Home Financials are based on the most recent Mortgage that was taken out on this home.
Original Mortgage
$300,000
Interest Rate
6.27%
Mortgage Type
Credit Line Revolving
Purchase Details
Closed on
May 31, 2002
Sold by
Sweeney Richard T
Bought by
Sweeney Richard T
Purchase Details
Closed on
Nov 20, 2001
Sold by
Pulte Home Corp
Bought by
Sweeney Richard T and Miller Donald E
Home Financials for this Owner
Home Financials are based on the most recent Mortgage that was taken out on this home.
Original Mortgage
$656,875
Interest Rate
6.57%
Mortgage Type
Stand Alone First
Purchase Details
Closed on
Oct 15, 1998
Sold by
West Coast Home Builders Inc
Bought by
Braddock & Logan Group Lp
Create a Home Valuation Report for This Property
The Home Valuation Report is an in-depth analysis detailing your home's value as well as a comparison with similar homes in the area
Home Values in the Area
Average Home Value in this Area
Purchase History
| Date | Buyer | Sale Price | Title Company |
|---|---|---|---|
| Tselenchuk Igor | -- | Radian Settlement Svcs Inc | |
| Tselenchuk Igor | -- | Radian Settlement Svcs Inc | |
| The Igor & Erin Tselenchuk 2014 Living T | -- | None Available | |
| Tselenckuk Igor | $675,000 | Pacific Coast Title Company | |
| Hatfield Gary L | $22,000 | Ticor Title Co Of California | |
| Hatfield Gary L | $1,170,000 | Ticor Title Company | |
| Miller Donald E | -- | Ticor Title Company | |
| Sweeney Richard T | -- | Ticor Title Company | |
| Sweeney Richard T | -- | -- | |
| Miller Donald E | -- | -- | |
| Sweeney Richard T | $657,000 | First American Title Guarant | |
| Braddock & Logan Group Lp | -- | First American Title Guarant |
Source: Public Records
Mortgage History
| Date | Status | Borrower | Loan Amount |
|---|---|---|---|
| Open | Tselenchuk Igor | $390,564 | |
| Closed | Tselenckuk Igor | $540,000 | |
| Previous Owner | Hatfield Gary L | $826,400 | |
| Previous Owner | Sweeney Richard T | $300,000 | |
| Previous Owner | Sweeney Richard T | $656,875 |
Source: Public Records
Tax History
| Year | Tax Paid | Tax Assessment Tax Assessment Total Assessment is a certain percentage of the fair market value that is determined by local assessors to be the total taxable value of land and additions on the property. | Land | Improvement |
|---|---|---|---|---|
| 2025 | $10,186 | $831,203 | $443,309 | $387,894 |
| 2024 | $9,755 | $814,906 | $434,617 | $380,289 |
| 2023 | $9,755 | $798,929 | $426,096 | $372,833 |
| 2022 | $9,636 | $783,265 | $417,742 | $365,523 |
| 2021 | $9,408 | $767,907 | $409,551 | $358,356 |
| 2019 | $9,235 | $745,132 | $397,404 | $347,728 |
| 2018 | $8,881 | $730,522 | $389,612 | $340,910 |
| 2017 | $8,593 | $716,199 | $381,973 | $334,226 |
| 2016 | $8,373 | $702,157 | $374,484 | $327,673 |
| 2015 | $8,297 | $691,611 | $368,859 | $322,752 |
| 2014 | $8,092 | $678,064 | $361,634 | $316,430 |
Source: Public Records
Map
Nearby Homes
- 5391 Fernbank Dr
- 5408 Oakstone Ct
- 5350 Fernbank Dr Unit 1
- 995 Rosehedge Ct
- 974 Rosehedge Ct
- 1109 Vista Point Ln
- 5535 Merritt Dr
- 1271 Kentucky Dr
- 1297 Kansas Cir
- 1346 Montana Dr
- 5468 Roundtree Dr Unit C
- 5506 Nebraska Dr
- 5555 Maryland Dr
- 5492 Roundtree Dr Unit A
- 5434 Roundtree Ct Unit A
- 5722 Roanwood Way
- 1120 Kenwal Rd Unit C
- 5817 Mitchell Canyon Ct
- 5451 Roundtree Place
- 1195 Kenwal Rd Unit B
- 826 Deer Spring Cir
- 818 Deer Spring Cir
- 825 Deer Spring Cir
- 830 Deer Spring Cir
- 5425 Woodhollow Ct
- 814 Deer Spring Cir
- 827 Deer Spring Cir
- 5419 Woodhollow Ct
- 832 Deer Spring Cir
- 5436 Woodleaf Ct
- 829 Deer Spring Cir
- 5431 Woodhollow Ct
- 5407 Woodhollow Ct
- 5430 Woodleaf Ct
- 5401 Woodhollow Ct
- 831 Deer Spring Cir
- 5447 Woodleaf Ct
- 5424 Woodleaf Ct
- 5441 Woodleaf Ct
- 5430 Woodhollow Ct
Your Personal Tour Guide
Ask me questions while you tour the home.