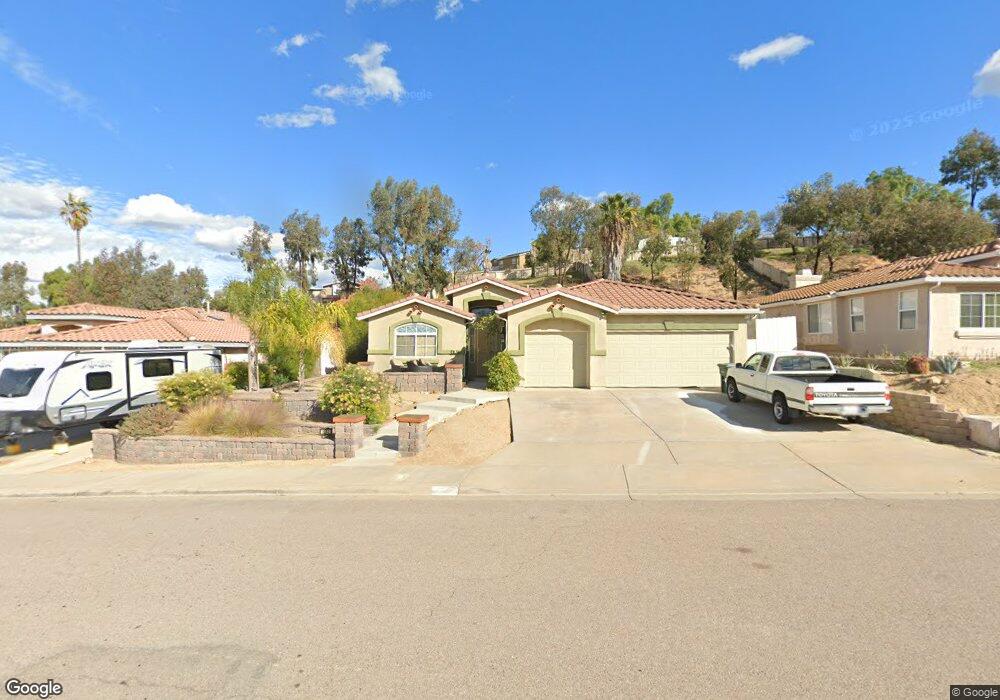
8243 Serenity Ct El Cajon, CA 92021
Estimated Value: $846,000 - $908,000
4
Beds
2
Baths
1,945
Sq Ft
$453/Sq Ft
Est. Value
About This Home
This home is located at 8243 Serenity Ct, El Cajon, CA 92021 and is currently estimated at $880,902, approximately $452 per square foot. 8243 Serenity Ct is a home located in San Diego County with nearby schools including Rios Elementary School, Los Coches Creek Middle School, and Granite Hills High School.
Ownership History
Date
Name
Owned For
Owner Type
Purchase Details
Closed on
Feb 26, 2016
Sold by
Duenow Kevin L
Bought by
Duenow Kevin L
Current Estimated Value
Purchase Details
Closed on
Nov 11, 2013
Sold by
Duenow Kevin L and Nagel Joyce
Bought by
Duenow Kevin L
Home Financials for this Owner
Home Financials are based on the most recent Mortgage that was taken out on this home.
Original Mortgage
$412,750
Outstanding Balance
$307,074
Interest Rate
4.17%
Mortgage Type
New Conventional
Estimated Equity
$573,828
Purchase Details
Closed on
Jul 25, 2007
Sold by
Duenow Kevin L and Duenow Joyce N
Bought by
Duenow Kevin L and Duenow Joyce N
Home Financials for this Owner
Home Financials are based on the most recent Mortgage that was taken out on this home.
Original Mortgage
$431,250
Interest Rate
6.37%
Mortgage Type
New Conventional
Purchase Details
Closed on
Apr 20, 2006
Sold by
Duenow Kevin L and Duenow Joyce N
Bought by
Duenow Kevin L and Duenow Joyce N
Purchase Details
Closed on
Sep 2, 1997
Sold by
Los Coches Llc
Bought by
Duenow Kevin L and Duenow Joyce N
Home Financials for this Owner
Home Financials are based on the most recent Mortgage that was taken out on this home.
Original Mortgage
$187,900
Interest Rate
7.54%
Create a Home Valuation Report for This Property
The Home Valuation Report is an in-depth analysis detailing your home's value as well as a comparison with similar homes in the area
Home Values in the Area
Average Home Value in this Area
Purchase History
| Date | Buyer | Sale Price | Title Company |
|---|---|---|---|
| Duenow Kevin L | -- | Accommodation | |
| Duenow Kevin L | -- | Chicago Title Company | |
| Duenow Kevin L | -- | Accommodation | |
| Duenow Kevin L | -- | Southland Title Company | |
| Duenow Kevin L | -- | None Available | |
| Duenow Kevin L | $221,500 | Southland Title |
Source: Public Records
Mortgage History
| Date | Status | Borrower | Loan Amount |
|---|---|---|---|
| Open | Duenow Kevin L | $412,750 | |
| Closed | Duenow Kevin L | $431,250 | |
| Closed | Duenow Kevin L | $187,900 |
Source: Public Records
Tax History Compared to Growth
Tax History
| Year | Tax Paid | Tax Assessment Tax Assessment Total Assessment is a certain percentage of the fair market value that is determined by local assessors to be the total taxable value of land and additions on the property. | Land | Improvement |
|---|---|---|---|---|
| 2025 | $4,803 | $353,077 | $111,757 | $241,320 |
| 2024 | $4,803 | $346,155 | $109,566 | $236,589 |
| 2023 | $4,660 | $339,368 | $107,418 | $231,950 |
| 2022 | $4,561 | $332,714 | $105,312 | $227,402 |
| 2021 | $4,508 | $326,192 | $103,248 | $222,944 |
| 2020 | $4,424 | $322,848 | $102,190 | $220,658 |
| 2019 | $4,363 | $316,519 | $100,187 | $216,332 |
| 2018 | $4,248 | $310,314 | $98,223 | $212,091 |
| 2017 | $594 | $304,231 | $96,298 | $207,933 |
| 2016 | $3,973 | $298,266 | $94,410 | $203,856 |
| 2015 | $3,946 | $293,786 | $92,992 | $200,794 |
| 2014 | $3,875 | $288,032 | $91,171 | $196,861 |
Source: Public Records
Map
Nearby Homes
- 8338 Ora Belle Ln
- 13217 Aurora Dr Unit 74
- 13217 Aurora Dr Unit 39
- 13217 Aurora Dr Unit 33
- 13217 Aurora Dr Unit 85
- 13217 Aurora Dr Unit 28
- 13217 Aurora Dr Unit 11
- 13111 Beacon View Ln
- 8510 Calle de Buena fe
- 8624 Sage Shadow Dr
- 13214 Spring Mountain Rd
- 13461 Lori Place
- 0000 Calle de Buena fe Unit 75
- 13162 Highway 8 Business Unit 19
- 13162 Highway 8 Business Unit 117
- 13162 Highway 8 Business Unit 112
- 13162 Highway 8 Business Unit 72
- 13162 Highway 8 Business Unit 7
- 13162 Highway 8 Business
- 13162 Highway 8 Business Unit 5
- 8251 Serenity Ct
- 8229 Serenity Ct
- 8273 Serenity Ct
- 8217 Serenity Ct
- 8291 Serenity Ct
- 8252 Serenity Ct
- 8228 Serenity Ct
- 8288 Serenity Ct
- 8303 Serenity Ct
- 8149 Medill Ave
- 0 Serenity Ct Unit 140008330
- 0 Serenity Ct Unit 150045723
- 8201 Serenity Ct
- 8319 Serenity Ct
- 8314 Serenity Ct
- 8204 Serenity Ct
- 8210 Serenity Ct
- 8211 Medill Ave
- 8214 Serenity Ct
- 8217 Medill Ave