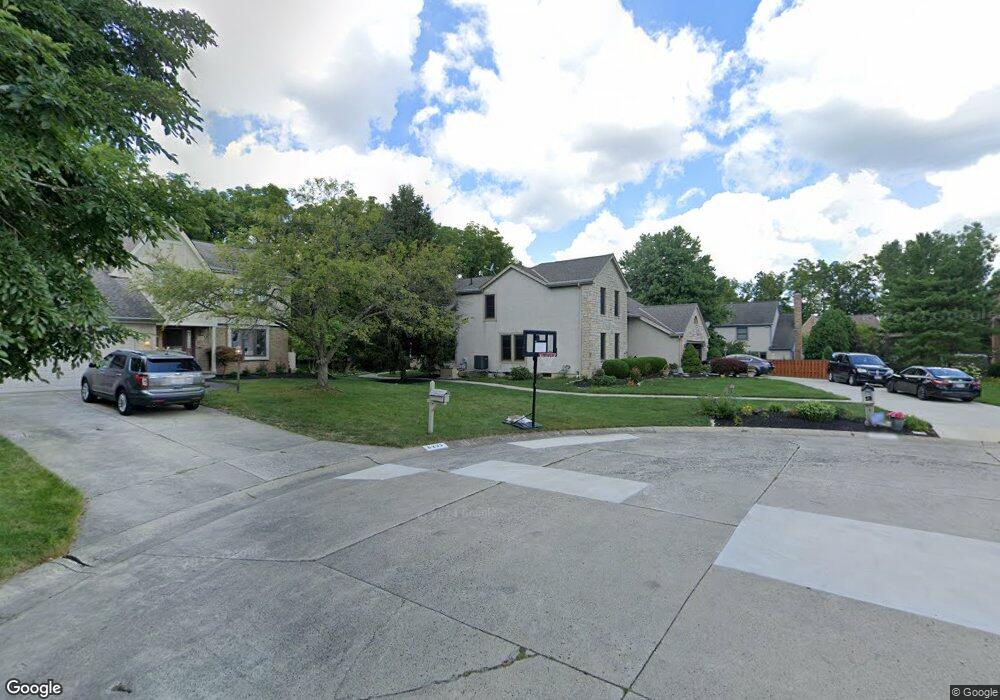
8245 Markhaven Ct Columbus, OH 43235
Estimated Value: $501,000 - $713,000
4
Beds
3
Baths
2,922
Sq Ft
$219/Sq Ft
Est. Value
About This Home
This home is located at 8245 Markhaven Ct, Columbus, OH 43235 and is currently estimated at $640,940, approximately $219 per square foot. 8245 Markhaven Ct is a home located in Franklin County with nearby schools including Worthington Hills Elementary School, McCord Middle School, and Worthington Kilbourne High School.
Ownership History
Date
Name
Owned For
Owner Type
Purchase Details
Closed on
Aug 16, 2002
Sold by
Stanley S Mark and Stanley Janet L
Bought by
Andrews Max A and Andrews Kathleen A
Current Estimated Value
Purchase Details
Closed on
Jan 3, 1989
Bought by
Stanley Stanley S and Stanley Janet L
Create a Home Valuation Report for This Property
The Home Valuation Report is an in-depth analysis detailing your home's value as well as a comparison with similar homes in the area
Home Values in the Area
Average Home Value in this Area
Purchase History
| Date | Buyer | Sale Price | Title Company |
|---|---|---|---|
| Andrews Max A | $267,500 | -- | |
| Stanley Stanley S | $212,600 | -- |
Source: Public Records
Tax History
| Year | Tax Paid | Tax Assessment Tax Assessment Total Assessment is a certain percentage of the fair market value that is determined by local assessors to be the total taxable value of land and additions on the property. | Land | Improvement |
|---|---|---|---|---|
| 2025 | $14,484 | $199,080 | $44,100 | $154,980 |
| 2024 | $14,484 | $199,080 | $44,100 | $154,980 |
| 2023 | $12,577 | $199,080 | $44,100 | $154,980 |
| 2022 | $11,985 | $150,260 | $37,800 | $112,460 |
| 2021 | $11,172 | $150,260 | $37,800 | $112,460 |
| 2020 | $10,848 | $150,260 | $37,800 | $112,460 |
| 2019 | $9,912 | $123,660 | $31,500 | $92,160 |
| 2018 | $9,243 | $123,660 | $31,500 | $92,160 |
| 2017 | $8,937 | $123,660 | $31,500 | $92,160 |
| 2016 | $8,827 | $111,520 | $25,310 | $86,210 |
| 2015 | $8,828 | $111,520 | $25,310 | $86,210 |
| 2014 | $8,459 | $111,520 | $25,310 | $86,210 |
| 2013 | $3,978 | $105,105 | $22,995 | $82,110 |
Source: Public Records
Map
Nearby Homes
- 8292 Breckenridge Way
- 8622 Renford Ct
- 1810 Calico Ct
- 1539 Clubview Blvd S
- 8213 Longhorn Rd
- 8205 Longhorn Rd
- 1908 Lost Valley Rd
- 1483 Dogwood Loop
- 1473 Dogwood Loop
- 941 Clubview Blvd S
- 0 Edgecliff Dr Unit 226005827
- 7965 Boothbay Ct Unit 20
- 8144 Mount Air Place Unit 8144
- 1760 Fallhaven Dr
- 1001 Rutherglen Dr
- 2074 Hard Rd
- 7735 Schoolway Ct
- 1327 Donahey St
- 2514 Tevis Ann Ct
- 7480 Gardenview Place
- 8235 Markhaven Ct
- 1527 Newcomer Rd
- 1537 Newcomer Rd
- 8255 Markhaven Dr
- 8245 Markhaven Dr
- 8256 Copperfield Dr
- 8225 Markhaven Ct
- 8244 Copperfield Dr
- 1515 Newcomer Rd
- 8266 Copperfield Dr
- 8232 Copperfield Dr
- 8215 Markhaven Dr
- 8205 Markhaven Dr
- 8222 Copperfield Dr
- 1544 Newcomer Rd
- 1536 Newcomer Rd
- 8195 Markhaven Dr
- 8256 Markhaven Dr
- 8248 Markhaven Dr
- 1552 Newcomer Rd
Your Personal Tour Guide
Ask me questions while you tour the home.