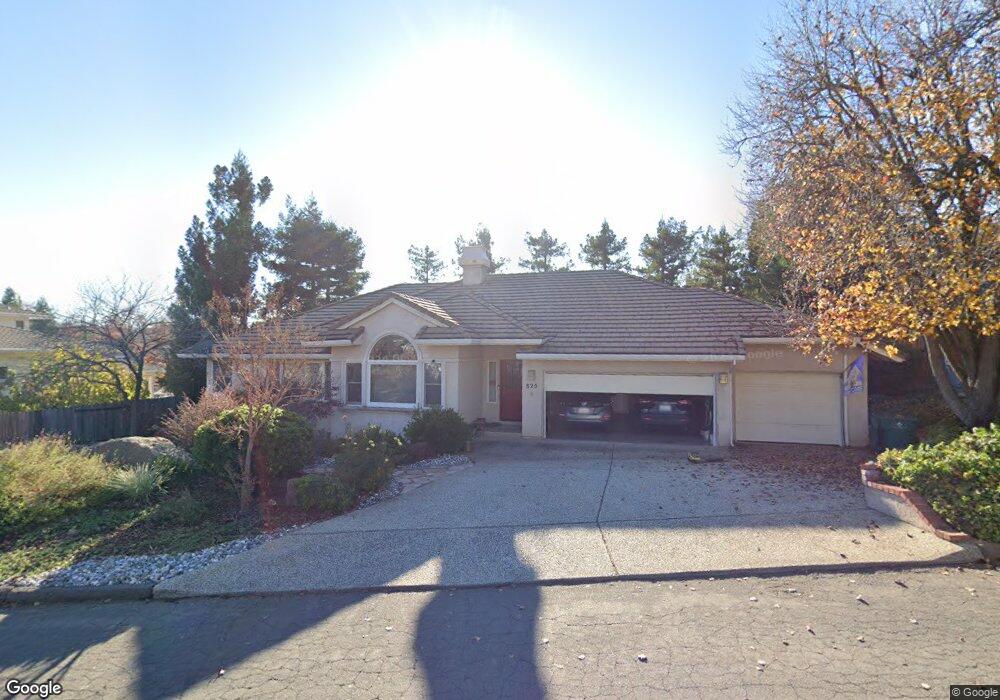
825 Oak Crest Cir Placerville, CA 95667
Estimated Value: $494,000 - $650,000
4
Beds
2
Baths
2,295
Sq Ft
$263/Sq Ft
Est. Value
About This Home
This home is located at 825 Oak Crest Cir, Placerville, CA 95667 and is currently estimated at $604,355, approximately $263 per square foot. 825 Oak Crest Cir is a home located in El Dorado County with nearby schools including El Dorado High School, Country Day Montessori, and El Dorado Adventist School.
Ownership History
Date
Name
Owned For
Owner Type
Purchase Details
Closed on
Jul 1, 2025
Sold by
Marbut Emogene and 2007 Emogene Marbut Trust
Bought by
Haller 2025 Trust and Haller
Current Estimated Value
Purchase Details
Closed on
Jan 23, 2007
Sold by
Marbut Emogene
Bought by
Marbut Emogene and The 2007 Emogene Marbut Trust
Purchase Details
Closed on
Jan 10, 2001
Sold by
Witter David Kenneth
Bought by
Marbut Emogene
Home Financials for this Owner
Home Financials are based on the most recent Mortgage that was taken out on this home.
Original Mortgage
$115,000
Interest Rate
7.54%
Purchase Details
Closed on
Mar 17, 1998
Sold by
Witter Marie Yoko
Bought by
Witter David Kenneth
Home Financials for this Owner
Home Financials are based on the most recent Mortgage that was taken out on this home.
Original Mortgage
$188,000
Interest Rate
7.06%
Create a Home Valuation Report for This Property
The Home Valuation Report is an in-depth analysis detailing your home's value as well as a comparison with similar homes in the area
Home Values in the Area
Average Home Value in this Area
Purchase History
| Date | Buyer | Sale Price | Title Company |
|---|---|---|---|
| Haller 2025 Trust | -- | None Listed On Document | |
| Marbut Emogene | -- | None Available | |
| Marbut Emogene | $289,000 | Fidelity National Title Co | |
| Witter David Kenneth | -- | Fidelity National Title |
Source: Public Records
Mortgage History
| Date | Status | Borrower | Loan Amount |
|---|---|---|---|
| Previous Owner | Marbut Emogene | $115,000 | |
| Previous Owner | Witter David Kenneth | $188,000 |
Source: Public Records
Tax History Compared to Growth
Tax History
| Year | Tax Paid | Tax Assessment Tax Assessment Total Assessment is a certain percentage of the fair market value that is determined by local assessors to be the total taxable value of land and additions on the property. | Land | Improvement |
|---|---|---|---|---|
| 2025 | $4,358 | $427,912 | $112,997 | $314,915 |
| 2024 | $4,358 | $419,523 | $110,782 | $308,741 |
| 2023 | $4,306 | $411,298 | $108,610 | $302,688 |
| 2022 | $4,244 | $403,234 | $106,481 | $296,753 |
| 2021 | $4,194 | $395,329 | $104,394 | $290,935 |
| 2020 | $4,131 | $391,276 | $103,324 | $287,952 |
| 2019 | $4,154 | $383,605 | $101,299 | $282,306 |
| 2018 | $4,029 | $376,084 | $99,313 | $276,771 |
| 2017 | $3,969 | $368,711 | $97,366 | $271,345 |
| 2016 | $3,908 | $361,482 | $95,457 | $266,025 |
| 2015 | $3,730 | $356,054 | $94,024 | $262,030 |
| 2014 | $3,730 | $349,082 | $92,183 | $256,899 |
Source: Public Records
Map
Nearby Homes
- 2528 Debera Ct
- 2573 Bryan Way
- 2770 Sleepy Hollow Ct
- 3371 Golden Chain Hwy
- 837 Vivian Ct
- 2830 Coloma St
- 636 Canal St
- 2849 Coloma St
- 645 Myrtle Ave
- 2874 Hidden Springs Cir
- 2854 Hidden Springs Cir
- 726 Quartz Mountain Dr
- 0 Quartz Mountain Dr
- 754 Quartz Mountain Dr
- 2850 Hidden Springs Cir
- 2446 Prado Vista Rd
- 2846 Hidden Springs Cir
- 0 Ray Lawyer Dr Unit 225065793
- 2929 Glenwood Ln Unit 121
- 2624 Liberty Mine Ct
- 833 Oak Crest Cir
- 821 Oak Crest Cir
- 721 Oak Crest Cir
- 820 Oak Crest Cir
- 817 Oak Crest Cir
- 830 Oak Crest Cir
- 729 Oak Crest Cir
- 707 Oak Crest Cir
- 841 Oak Crest Cir
- 813 Oak Crest Cir
- 836 Oak Crest Cir
- 0 Bryan Way
- 741 Oak Crest Cir
- 1015 Oak Crest Ct
- 765 Oak Crest Cir
- 753 Oak Crest Cir
- 995 Oak Trail Ct
- 805 Oak Crest Cir
- 769 Oak Crest Cir
- 842 Oak Crest Cir