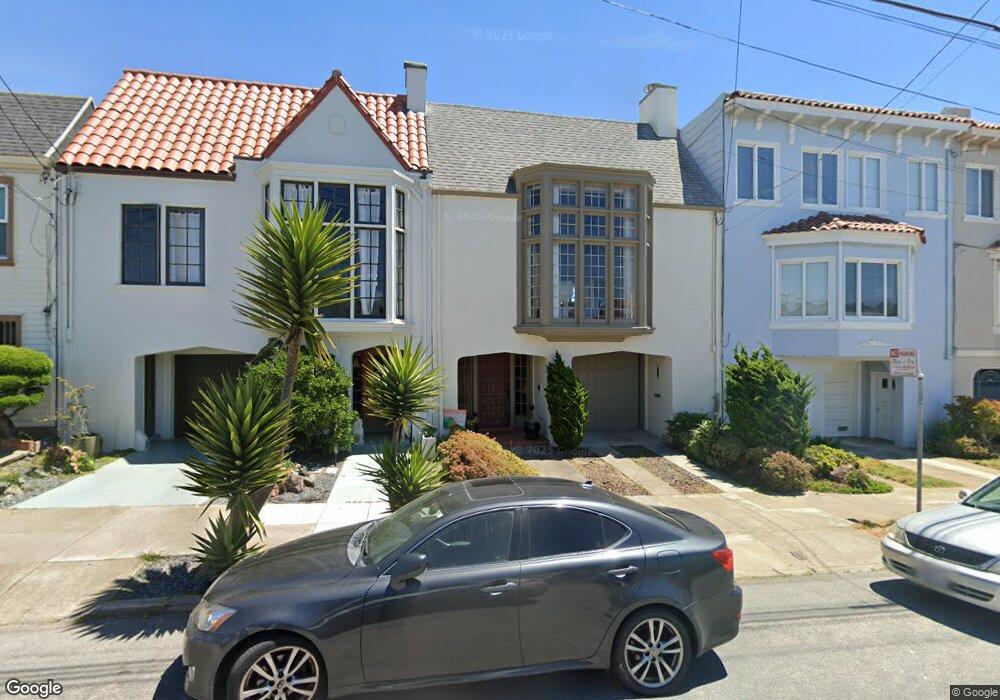
826 39th Ave San Francisco, CA 94121
Outer Richmond NeighborhoodEstimated Value: $1,450,254 - $2,212,000
--
Bed
1
Bath
2,006
Sq Ft
$868/Sq Ft
Est. Value
About This Home
This home is located at 826 39th Ave, San Francisco, CA 94121 and is currently estimated at $1,742,064, approximately $868 per square foot. 826 39th Ave is a home located in San Francisco County with nearby schools including Lafayette Elementary School, Presidio Middle School, and St. Thomas The Apostle School.
Ownership History
Date
Name
Owned For
Owner Type
Purchase Details
Closed on
Sep 14, 2010
Sold by
Mettling Jocasta
Bought by
Mettling Jocasta
Current Estimated Value
Purchase Details
Closed on
Jun 9, 2004
Sold by
Mettling Elizabeth
Bought by
Mettling Elizabeth
Purchase Details
Closed on
May 16, 2003
Sold by
Mettling Jerry
Bought by
Mettling Elizabeth
Create a Home Valuation Report for This Property
The Home Valuation Report is an in-depth analysis detailing your home's value as well as a comparison with similar homes in the area
Home Values in the Area
Average Home Value in this Area
Purchase History
| Date | Buyer | Sale Price | Title Company |
|---|---|---|---|
| Mettling Jocasta | -- | None Available | |
| Mettling Jocasta | -- | None Available | |
| Mettling Elizabeth | -- | -- | |
| Mettling Elizabeth | -- | -- |
Source: Public Records
Tax History Compared to Growth
Tax History
| Year | Tax Paid | Tax Assessment Tax Assessment Total Assessment is a certain percentage of the fair market value that is determined by local assessors to be the total taxable value of land and additions on the property. | Land | Improvement |
|---|---|---|---|---|
| 2025 | $1,068 | $90,490 | $45,245 | $45,245 |
| 2024 | $1,068 | $88,716 | $44,358 | $44,358 |
| 2023 | $1,053 | $86,978 | $43,489 | $43,489 |
| 2022 | $1,034 | $85,274 | $42,637 | $42,637 |
| 2021 | $1,017 | $83,602 | $41,801 | $41,801 |
| 2020 | $1,019 | $82,746 | $41,373 | $41,373 |
| 2019 | $986 | $81,124 | $40,562 | $40,562 |
| 2018 | $955 | $79,534 | $39,767 | $39,767 |
| 2017 | $1,224 | $77,976 | $38,988 | $38,988 |
| 2016 | $1,171 | $76,448 | $38,224 | $38,224 |
| 2015 | $345 | $79,142 | $39,571 | $39,571 |
| 2014 | $1,167 | $77,592 | $38,796 | $38,796 |
Source: Public Records
Map
Nearby Homes