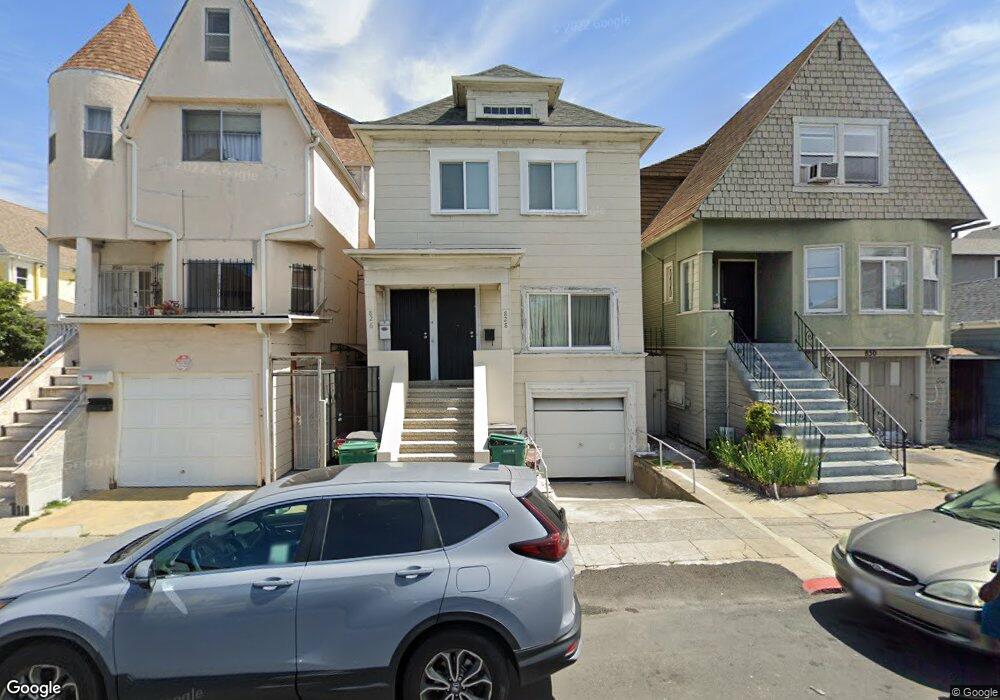
826 E 18th St Oakland, CA 94606
Clinton NeighborhoodEstimated Value: $629,000 - $875,000
5
Beds
3
Baths
2,088
Sq Ft
$349/Sq Ft
Est. Value
About This Home
This home is located at 826 E 18th St, Oakland, CA 94606 and is currently estimated at $728,223, approximately $348 per square foot. 826 E 18th St is a home located in Alameda County with nearby schools including Franklin Elementary School, Roosevelt Middle School, and Oakland High School.
Ownership History
Date
Name
Owned For
Owner Type
Purchase Details
Closed on
Mar 11, 2022
Sold by
Bing Chen Yu
Bought by
2022 Living Trust
Current Estimated Value
Purchase Details
Closed on
Jan 9, 2021
Sold by
Chu Richard Shek Yee and Chen Yu Bing
Bought by
Chen Yu Bing and Chu Madison
Purchase Details
Closed on
Aug 21, 1995
Sold by
Chu Richard
Bought by
Chen Annie Yu Bing
Home Financials for this Owner
Home Financials are based on the most recent Mortgage that was taken out on this home.
Original Mortgage
$107,000
Interest Rate
7.5%
Purchase Details
Closed on
Nov 17, 1994
Sold by
Chu Richard and Chu Yuk Sheung
Bought by
Chu Richard and Chen Annie Yu Bing
Home Financials for this Owner
Home Financials are based on the most recent Mortgage that was taken out on this home.
Original Mortgage
$107,200
Interest Rate
11.25%
Create a Home Valuation Report for This Property
The Home Valuation Report is an in-depth analysis detailing your home's value as well as a comparison with similar homes in the area
Home Values in the Area
Average Home Value in this Area
Purchase History
| Date | Buyer | Sale Price | Title Company |
|---|---|---|---|
| 2022 Living Trust | -- | None Listed On Document | |
| Chen Yu Bing | -- | None Listed On Document | |
| Chen Annie Yu Bing | -- | Fidelity National Title Ins | |
| Chu Richard | $69,500 | Fidelity National Title |
Source: Public Records
Mortgage History
| Date | Status | Borrower | Loan Amount |
|---|---|---|---|
| Previous Owner | Chen Annie Yu Bing | $107,000 | |
| Previous Owner | Chu Richard | $107,200 |
Source: Public Records
Tax History
| Year | Tax Paid | Tax Assessment Tax Assessment Total Assessment is a certain percentage of the fair market value that is determined by local assessors to be the total taxable value of land and additions on the property. | Land | Improvement |
|---|---|---|---|---|
| 2025 | $4,510 | $174,354 | $60,689 | $113,665 |
| 2024 | $4,510 | $170,936 | $59,499 | $111,437 |
| 2023 | $4,586 | $167,585 | $58,333 | $109,252 |
| 2022 | $4,329 | $164,299 | $57,189 | $107,110 |
| 2021 | $3,937 | $161,078 | $56,068 | $105,010 |
| 2020 | $3,890 | $159,427 | $55,493 | $103,934 |
| 2019 | $3,615 | $156,301 | $54,405 | $101,896 |
| 2018 | $3,543 | $153,236 | $53,338 | $99,898 |
| 2017 | $3,356 | $150,233 | $52,293 | $97,940 |
| 2016 | $3,172 | $147,288 | $51,268 | $96,020 |
| 2015 | $3,150 | $145,076 | $50,498 | $94,578 |
| 2014 | $3,177 | $142,235 | $49,509 | $92,726 |
Source: Public Records
Map
Nearby Homes
Your Personal Tour Guide
Ask me questions while you tour the home.