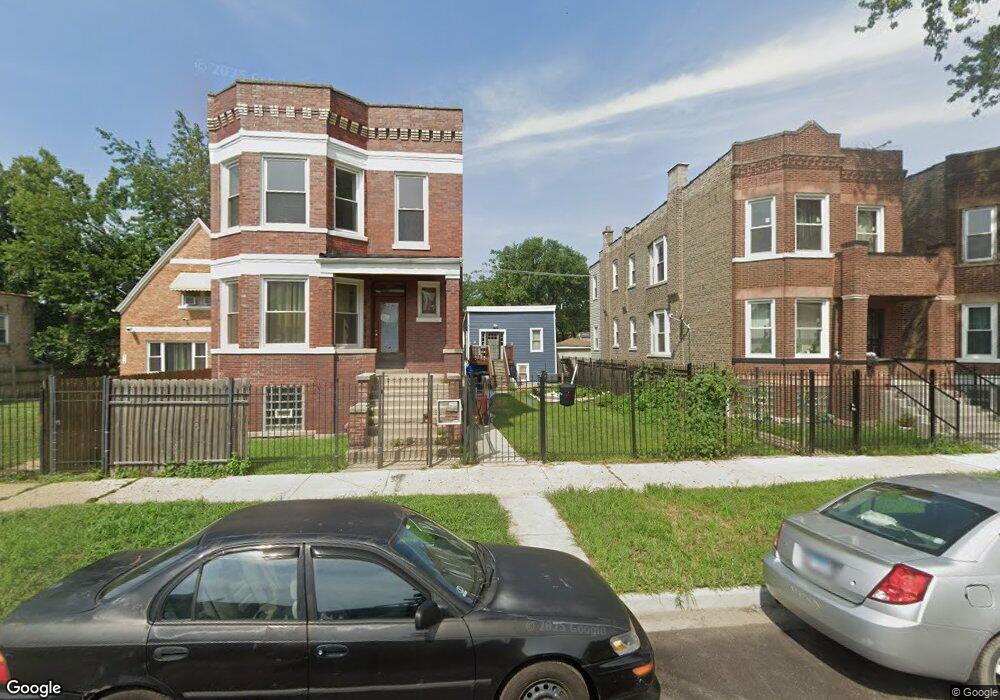
826 N Ridgeway Ave Chicago, IL 60651
Humboldt Park NeighborhoodEstimated Value: $128,000 - $228,000
4
Beds
2
Baths
1,000
Sq Ft
$200/Sq Ft
Est. Value
About This Home
This home is located at 826 N Ridgeway Ave, Chicago, IL 60651 and is currently estimated at $200,313, approximately $200 per square foot. 826 N Ridgeway Ave is a home located in Cook County with nearby schools including Ward L Elementary School, Orr Academy High School, and KIPP One Academy.
Ownership History
Date
Name
Owned For
Owner Type
Purchase Details
Closed on
Jun 15, 2017
Sold by
Pena Alan
Bought by
Cabrera Yeimy
Current Estimated Value
Home Financials for this Owner
Home Financials are based on the most recent Mortgage that was taken out on this home.
Original Mortgage
$76,000
Outstanding Balance
$63,593
Interest Rate
4.5%
Mortgage Type
New Conventional
Estimated Equity
$136,720
Purchase Details
Closed on
Jul 6, 2011
Sold by
Chicagoland Developers Group Inc
Bought by
Pena Alan
Purchase Details
Closed on
Sep 30, 2010
Sold by
Wells Fargo Bank National Association
Bought by
Chicagoland Developers Group Inc
Purchase Details
Closed on
Jun 9, 2010
Sold by
Robinson Channet
Bought by
Wells Fargo Bank National Association
Purchase Details
Closed on
Jul 26, 2004
Sold by
Robinson Virgie L
Bought by
Robinson Channet
Home Financials for this Owner
Home Financials are based on the most recent Mortgage that was taken out on this home.
Original Mortgage
$89,600
Interest Rate
7.87%
Mortgage Type
Stand Alone First
Create a Home Valuation Report for This Property
The Home Valuation Report is an in-depth analysis detailing your home's value as well as a comparison with similar homes in the area
Home Values in the Area
Average Home Value in this Area
Purchase History
| Date | Buyer | Sale Price | Title Company |
|---|---|---|---|
| Cabrera Yeimy | $95,000 | Attorney | |
| Pena Alan | -- | First American Title Ins Co | |
| Chicagoland Developers Group Inc | $9,000 | Forum Title Insurance Co | |
| Wells Fargo Bank National Association | -- | None Available | |
| Robinson Channet | -- | -- |
Source: Public Records
Mortgage History
| Date | Status | Borrower | Loan Amount |
|---|---|---|---|
| Open | Cabrera Yeimy | $76,000 | |
| Previous Owner | Robinson Channet | $89,600 |
Source: Public Records
Tax History
| Year | Tax Paid | Tax Assessment Tax Assessment Total Assessment is a certain percentage of the fair market value that is determined by local assessors to be the total taxable value of land and additions on the property. | Land | Improvement |
|---|---|---|---|---|
| 2025 | $1,838 | $14,900 | $5,781 | $9,119 |
| 2024 | $1,838 | $14,900 | $5,781 | $9,119 |
| 2023 | $2,468 | $12,000 | $3,165 | $8,835 |
| 2022 | $2,468 | $12,000 | $3,165 | $8,835 |
| 2021 | $2,413 | $12,000 | $3,165 | $8,835 |
| 2020 | $2,095 | $9,405 | $3,671 | $5,734 |
| 2019 | $2,100 | $10,450 | $3,671 | $6,779 |
| 2018 | $2,064 | $10,450 | $3,671 | $6,779 |
| 2017 | $1,666 | $11,116 | $3,281 | $7,835 |
| 2016 | $1,726 | $11,116 | $3,281 | $7,835 |
| 2015 | $1,556 | $11,116 | $3,281 | $7,835 |
| 2014 | $1,112 | $8,560 | $3,125 | $5,435 |
| 2013 | $1,079 | $8,560 | $3,125 | $5,435 |
Source: Public Records
Map
Nearby Homes
- 822 N Lawndale Ave
- 820 N Monticello Ave
- 921 N Avers Ave
- 931 N Lawndale Ave
- 711 N Ridgeway Ave
- 727 N Springfield Ave
- 717 N Springfield Ave
- 1010 N Ridgeway Ave
- 707 N Monticello Ave
- 3546 W Chicago Ave
- 1028 N Hamlin Ave
- 1029 N Avers Ave
- 943 N Central Park Ave
- 903 N Drake Ave
- 942 N Harding Ave
- 3921 W Huron St Unit 3
- 642 N Central Park Ave
- 3914 W Huron St
- 3804 W Ohio St
- 921 N Drake Ave
- 824 N Ridgeway Ave Unit 2
- 824 N Ridgeway Ave
- 830 N Ridgeway Ave
- 822 N Ridgeway Ave
- 832 N Ridgeway Ave
- 832 N Ridgeway Ave
- 834 N Ridgeway Ave
- 818 N Ridgeway Ave
- 816 N Ridgeway Ave
- 836 N Ridgeway Ave
- 836 N Ridgeway Ave Unit 2
- 836 N Ridgeway Ave Unit 3
- 836 N Ridgeway Ave Unit 1
- 836 N Ridgeway Ave
- 840 N Ridgeway Ave
- 840 N Ridgeway Ave
- 814 N Ridgeway Ave Unit 101
- 814 N Ridgeway Ave Unit 103
- 814 N Ridgeway Ave Unit 102
- 831 N Hamlin Ave
Your Personal Tour Guide
Ask me questions while you tour the home.