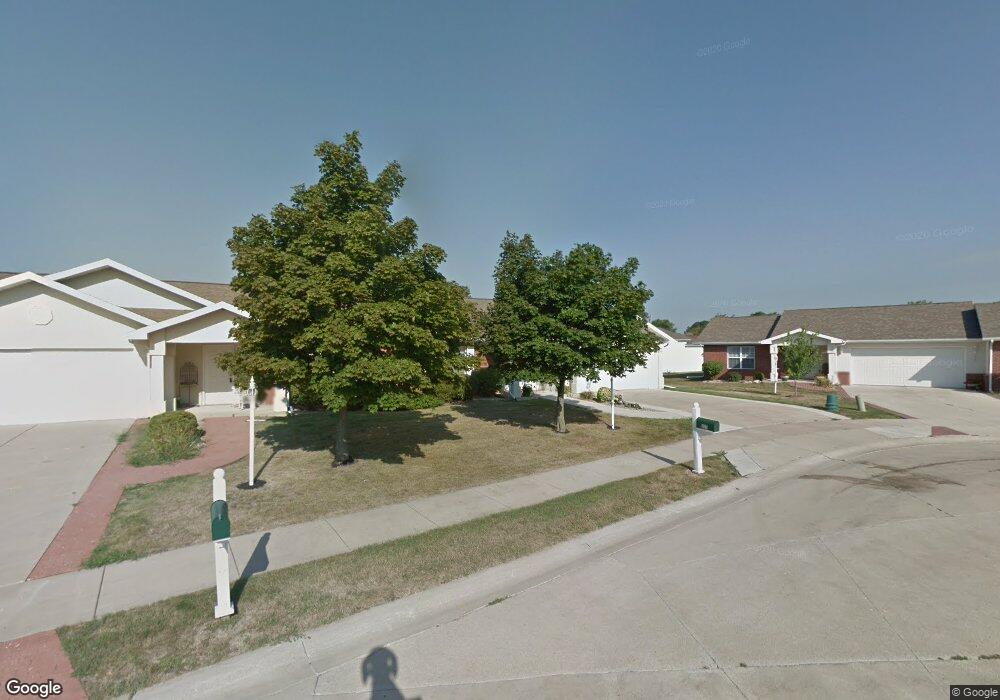
826 Sunset Dr Kewanee, IL 61443
Estimated Value: $168,000 - $181,000
2
Beds
--
Bath
1,582
Sq Ft
$110/Sq Ft
Est. Value
About This Home
This home is located at 826 Sunset Dr, Kewanee, IL 61443 and is currently estimated at $174,517, approximately $110 per square foot. 826 Sunset Dr is a home located in Henry County with nearby schools including Wethersfield Elementary School, Wethersfield Junior/Senior High School, and Visitation Catholic School.
Ownership History
Date
Name
Owned For
Owner Type
Purchase Details
Closed on
Dec 31, 2021
Sold by
Dennison and Patricia
Bought by
Dennison David L and Dennison Lisa M
Current Estimated Value
Home Financials for this Owner
Home Financials are based on the most recent Mortgage that was taken out on this home.
Original Mortgage
$99,750
Outstanding Balance
$91,932
Interest Rate
3.11%
Mortgage Type
New Conventional
Estimated Equity
$82,585
Purchase Details
Closed on
Oct 28, 2016
Sold by
Demmler Jean
Bought by
Dennison Bruce and Dennison Patricia
Home Financials for this Owner
Home Financials are based on the most recent Mortgage that was taken out on this home.
Original Mortgage
$108,000
Interest Rate
3.42%
Mortgage Type
New Conventional
Create a Home Valuation Report for This Property
The Home Valuation Report is an in-depth analysis detailing your home's value as well as a comparison with similar homes in the area
Home Values in the Area
Average Home Value in this Area
Purchase History
| Date | Buyer | Sale Price | Title Company |
|---|---|---|---|
| Dennison David L | $133,000 | Barash & Everett Llc | |
| Dennison David L | $133,000 | None Listed On Document | |
| Dennison Bruce | $133,000 | None Available |
Source: Public Records
Mortgage History
| Date | Status | Borrower | Loan Amount |
|---|---|---|---|
| Open | Dennison David L | $99,750 | |
| Closed | Dennison David L | $99,750 | |
| Previous Owner | Dennison Bruce | $108,000 |
Source: Public Records
Tax History
| Year | Tax Paid | Tax Assessment Tax Assessment Total Assessment is a certain percentage of the fair market value that is determined by local assessors to be the total taxable value of land and additions on the property. | Land | Improvement |
|---|---|---|---|---|
| 2024 | $6,360 | $58,214 | $4,391 | $53,823 |
| 2023 | $6,000 | $53,407 | $4,028 | $49,379 |
| 2022 | $5,857 | $51,551 | $3,888 | $47,663 |
| 2021 | $4,626 | $50,293 | $3,793 | $46,500 |
| 2020 | $4,494 | $49,187 | $3,710 | $45,477 |
| 2019 | $4,392 | $49,210 | $3,711 | $45,499 |
| 2018 | $4,097 | $48,151 | $3,631 | $44,520 |
| 2017 | $4,011 | $45,849 | $3,584 | $42,265 |
| 2016 | $5,135 | $44,600 | $3,486 | $41,114 |
| 2015 | $5,209 | $43,092 | $3,368 | $39,724 |
| 2013 | $5,209 | $46,927 | $3,302 | $43,625 |
Source: Public Records
Map
Nearby Homes
- 136 W Mill St
- 702 Elliott St Unit 1
- 436 Hollis St
- 116 W Garfield St
- 215 W Prospect St
- 512 Commercial St
- 732 S Main St
- 714 S Main St
- 716 W 3rd St
- 422 Ross St
- 328 E Prospect St
- 712 Roosevelt Ave
- 202 Regina Ct
- 0 N Main St Unit E 2nd
- 522 E 5th St
- 701 E 9th St
- 1221 June St
- 2283 E 2750th St
- 24508 County Highway 28
- 806 NE 3rd St
Your Personal Tour Guide
Ask me questions while you tour the home.