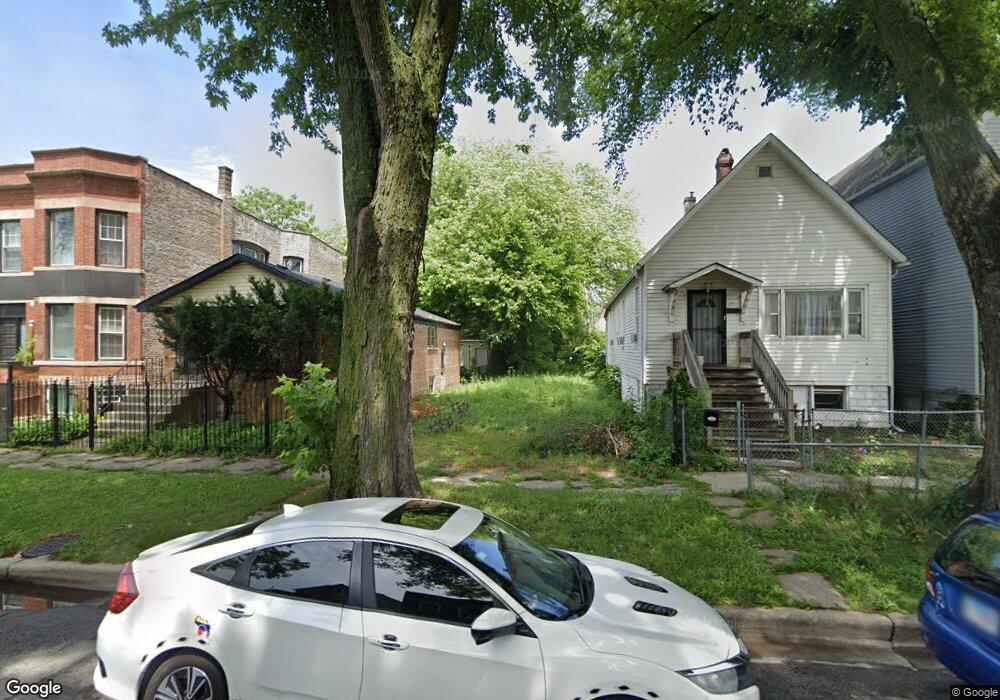
826 W 50th Place Chicago, IL 60609
Back of the Yards NeighborhoodEstimated Value: $30,174 - $273,000
5
Beds
2
Baths
2,002
Sq Ft
$76/Sq Ft
Est. Value
About This Home
This home is located at 826 W 50th Place, Chicago, IL 60609 and is currently estimated at $151,587, approximately $75 per square foot. 826 W 50th Place is a home located in Cook County with nearby schools including Sherman School of Excellence and St Gabriel Elementary School.
Ownership History
Date
Name
Owned For
Owner Type
Purchase Details
Closed on
Feb 21, 2012
Sold by
Bukrejewski Andrzej
Bought by
Karasinski Lukasz
Current Estimated Value
Purchase Details
Closed on
Nov 6, 2009
Sold by
Aurora Loan Services Llc
Bought by
Bukrejewski Andrzej
Purchase Details
Closed on
Oct 26, 2009
Sold by
Stalling Knighten Renetta V
Bought by
Aurora Loan Services Llc
Purchase Details
Closed on
Jul 16, 2003
Sold by
Chicago Title Land Trust Co
Bought by
Stalling Renetta
Purchase Details
Closed on
Dec 17, 2002
Sold by
Pledged Property Ii Llc
Bought by
Chicago Title Land Trust Co and Trust #1111492
Purchase Details
Closed on
Dec 11, 2002
Sold by
Jones John P
Bought by
Pledged Property Ii Llc
Purchase Details
Closed on
Aug 4, 1995
Sold by
Cole Taylor Bank
Bought by
Johns John P
Home Financials for this Owner
Home Financials are based on the most recent Mortgage that was taken out on this home.
Original Mortgage
$72,650
Interest Rate
8.75%
Create a Home Valuation Report for This Property
The Home Valuation Report is an in-depth analysis detailing your home's value as well as a comparison with similar homes in the area
Home Values in the Area
Average Home Value in this Area
Purchase History
| Date | Buyer | Sale Price | Title Company |
|---|---|---|---|
| Karasinski Lukasz | $14,000 | Old Republic National Title | |
| Bukrejewski Andrzej | $10,000 | St | |
| Aurora Loan Services Llc | -- | None Available | |
| Stalling Renetta | $163,000 | Cti | |
| Chicago Title Land Trust Co | $56,000 | First American Title | |
| Pledged Property Ii Llc | -- | -- | |
| Johns John P | $76,500 | -- |
Source: Public Records
Mortgage History
| Date | Status | Borrower | Loan Amount |
|---|---|---|---|
| Previous Owner | Johns John P | $72,650 |
Source: Public Records
Tax History Compared to Growth
Tax History
| Year | Tax Paid | Tax Assessment Tax Assessment Total Assessment is a certain percentage of the fair market value that is determined by local assessors to be the total taxable value of land and additions on the property. | Land | Improvement |
|---|---|---|---|---|
| 2024 | $429 | $938 | $938 | -- |
| 2023 | $418 | $2,031 | $2,031 | -- |
| 2022 | $418 | $2,031 | $2,031 | $0 |
| 2021 | $408 | $2,031 | $2,031 | $0 |
| 2020 | $452 | $2,031 | $2,031 | $0 |
| 2019 | $408 | $2,031 | $2,031 | $0 |
| 2018 | $401 | $2,031 | $2,031 | $0 |
| 2017 | $404 | $1,875 | $1,875 | $0 |
| 2016 | $376 | $1,875 | $1,875 | $0 |
| 2015 | $344 | $1,875 | $1,875 | $0 |
| 2014 | $2,551 | $13,748 | $1,718 | $12,030 |
| 2013 | $2,500 | $13,748 | $1,718 | $12,030 |
Source: Public Records
Map
Nearby Homes
- 845 W 50th Place
- 907 W 50th St
- 840 W 51st Place
- 738 W 51st St
- 947 W 51st St
- 949 W 51st St
- 735 W 48th Place
- 825 W 51st Place
- 829 W 51st Place
- 841 & 843 W 51st Place
- 5151 S Emerald Ave
- 4857 S Union Ave
- 5215 S Halsted St
- 5219 S Halsted St
- 1114 W 51st St
- 5242 S Sangamon St
- 5224 S Morgan St
- 848 W 53rd St
- 5221 S Carpenter St
- 4842 S Wallace St
- 830 W 50th Place
- 826 W 50th Place Unit 1
- 832 W 50th Place
- 824 W 50th Place
- 834 W 50th Place Unit 1
- 822 W 50th Place
- 818 W 50th Place
- 818 W 50th Place
- 840 W 50th Place
- 842 W 50th Place
- 833 W 50th St
- 825 W 50th St
- 823 W 50th St
- 837 W 50th St
- 827 W 50th Place
- 839 W 50th St
- 831 W 50th Place
- 831 W 50th Place
- 833 W 50th Place
- 835 W 50th Place