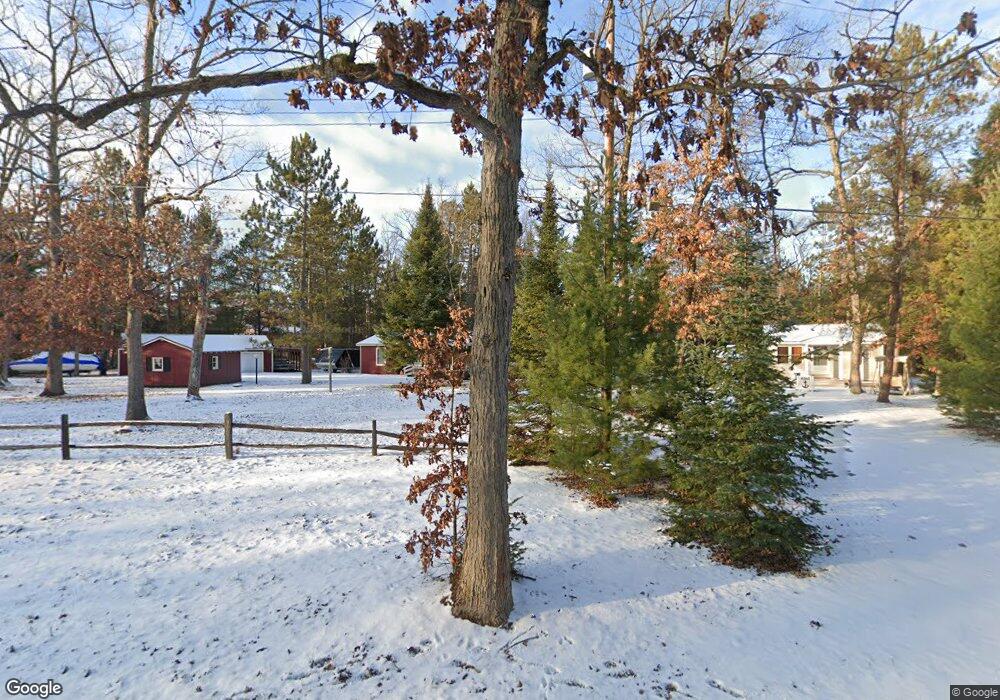
8266 Cedar Rd South Branch, MI 48761
Estimated Value: $150,696 - $209,000
3
Beds
2
Baths
1,720
Sq Ft
$103/Sq Ft
Est. Value
About This Home
This home is located at 8266 Cedar Rd, South Branch, MI 48761 and is currently estimated at $176,924, approximately $102 per square foot. 8266 Cedar Rd is a home located in Iosco County with nearby schools including Hale Elementary/Middle School and Hale High School.
Ownership History
Date
Name
Owned For
Owner Type
Purchase Details
Closed on
Sep 20, 2023
Sold by
Fix Jaime Sean and Fix Jeri Ann
Bought by
Jaime Sean Fix And Jeri Ann Fix Joint Family and Fix
Current Estimated Value
Purchase Details
Closed on
Feb 1, 2021
Sold by
Fix Jaime
Bought by
Fix Jaime and Fix Jeri A
Purchase Details
Closed on
Dec 4, 2020
Sold by
Forshee Chason C
Bought by
Fix Jaime and Fix Jeri A
Purchase Details
Closed on
Dec 2, 2020
Sold by
Rosenkranz Ft
Bought by
Fix Jaime
Purchase Details
Closed on
Nov 10, 2020
Sold by
Rosenkranz Ft
Bought by
Fix Jamie
Purchase Details
Closed on
Oct 29, 2020
Sold by
Schweihofer Tammy and Solgot Pamela
Bought by
Rosenkranz Ft
Purchase Details
Closed on
Oct 20, 2017
Sold by
Rosenkranz Robert
Bought by
Rosenkranz Robert L and Rosenkranz Family Trust
Purchase Details
Closed on
Nov 20, 2007
Sold by
Richard L Richard L and Solgot Judith A
Bought by
Schweihofer Tammy
Create a Home Valuation Report for This Property
The Home Valuation Report is an in-depth analysis detailing your home's value as well as a comparison with similar homes in the area
Home Values in the Area
Average Home Value in this Area
Purchase History
| Date | Buyer | Sale Price | Title Company |
|---|---|---|---|
| Jaime Sean Fix And Jeri Ann Fix Joint Family | -- | None Listed On Document | |
| Fix Jaime | -- | None Available | |
| Fix Jaime | -- | None Available | |
| Fix Jaime | $75,000 | None Available | |
| Fix Jamie | $75,000 | None Available | |
| Rosenkranz Ft | $60,000 | None Available | |
| Rosenkranz Robert L | -- | None Available | |
| Schweihofer Tammy | -- | -- |
Source: Public Records
Tax History Compared to Growth
Tax History
| Year | Tax Paid | Tax Assessment Tax Assessment Total Assessment is a certain percentage of the fair market value that is determined by local assessors to be the total taxable value of land and additions on the property. | Land | Improvement |
|---|---|---|---|---|
| 2025 | $1,669 | $71,800 | $71,800 | $0 |
| 2024 | $1,604 | $60,100 | $0 | $0 |
| 2023 | $1,151 | $52,600 | $52,600 | $0 |
| 2022 | $1,496 | $38,900 | $38,900 | $0 |
| 2021 | $1,839 | $45,800 | $45,800 | $0 |
| 2020 | $1,708 | $43,000 | $43,000 | $0 |
| 2019 | $1,637 | $41,600 | $41,600 | $0 |
| 2018 | $1,735 | $44,100 | $44,100 | $0 |
| 2017 | $1,673 | $43,800 | $43,800 | $0 |
| 2016 | $1,630 | $43,800 | $0 | $0 |
| 2015 | -- | $43,400 | $0 | $0 |
| 2014 | -- | $53,300 | $0 | $0 |
| 2013 | -- | $56,100 | $0 | $0 |
Source: Public Records
Map
Nearby Homes
- 7351 Chain Lake Dr
- lot 12 Paradise Dr
- 8200 Chain Lake Rd
- lOT 6 Jose Lake Dr
- 7796 Jose Lake Dr
- 7357 Shoreward Trail
- 7222 Blue Ox Trail
- 4790 Goodar Rd
- 5840 W Michaud Rd
- 5792 Greve Rd
- 7116 Wickert Rd
- 6924 Leslie
- 6152 Evergreen Dr
- 5500 NE County Line Rd
- 6548 Belfry Trail
- 6160 Rollways Rd
- 8446 Bamfield Rd
- 188 Campbell St
- 4998 N Main St
- 5020 N Main St
- 8263 Cedar Rd
- 8302 Cedar Rd
- 8253 Cedar Rd
- 8310 Cedar Rd
- 8310 Cedar Rd
- 7381 Chain Lake Dr
- 8295 Cedar Rd
- 8297 Cedar Rd
- 8255 Cedar Rd
- 8326 Cedar Rd
- 8260 Cedar Rd
- 8309 Cedar Rd
- 8313 Cedar Rd
- 7350 Chain Lake Dr
- 8285 Chain Lake Dr
- 8315 Cedar Rd
- 7355 Chain Lake Dr
- 8310 Willingham Ln
- 8332 Cedar Rd
- 8317 Cedar Rd