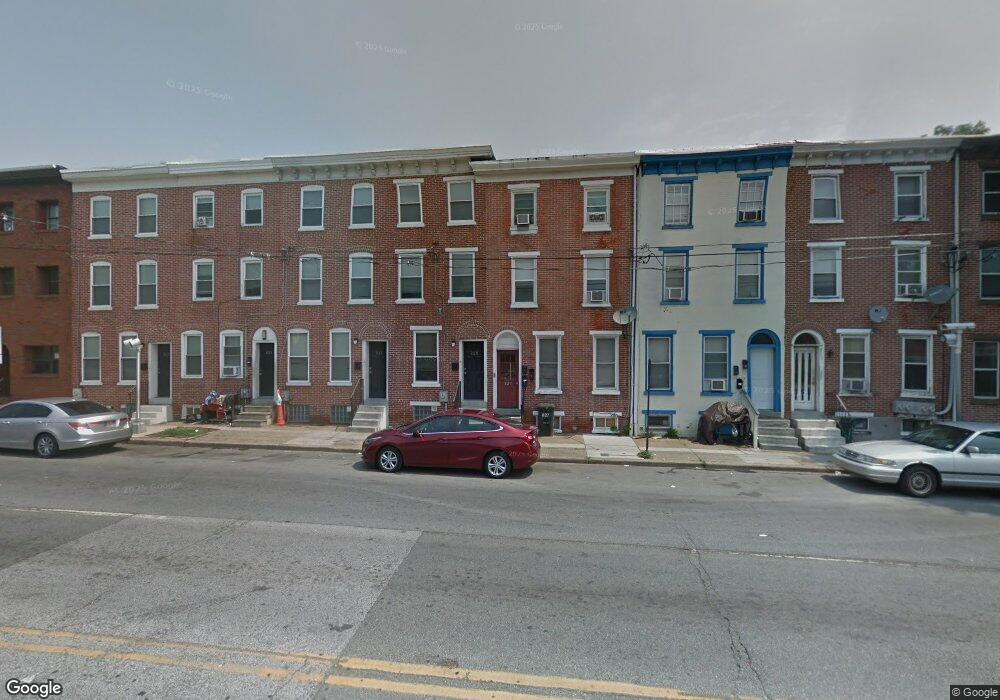
827 W 4th St Wilmington, DE 19801
Downtown Wilmington NeighborhoodEstimated Value: $128,000 - $175,000
4
Beds
3
Baths
1,824
Sq Ft
$83/Sq Ft
Est. Value
About This Home
This home is located at 827 W 4th St, Wilmington, DE 19801 and is currently estimated at $151,500, approximately $83 per square foot. 827 W 4th St is a home located in New Castle County with nearby schools including The Bancroft School, The Bayard School, and Newark High School.
Ownership History
Date
Name
Owned For
Owner Type
Purchase Details
Closed on
Jul 24, 2025
Sold by
Byrds Nest Llc
Bought by
G Properties Llc
Current Estimated Value
Home Financials for this Owner
Home Financials are based on the most recent Mortgage that was taken out on this home.
Original Mortgage
$230,000
Outstanding Balance
$192,737
Interest Rate
6.77%
Mortgage Type
Construction
Estimated Equity
-$41,237
Purchase Details
Closed on
Aug 16, 2016
Sold by
Byrd James A and Byrd Charlotte N
Bought by
Byrd S Nest Llc
Purchase Details
Closed on
Aug 1, 1987
Bought by
Byrd James A and Byrd Charlotte N
Create a Home Valuation Report for This Property
The Home Valuation Report is an in-depth analysis detailing your home's value as well as a comparison with similar homes in the area
Home Values in the Area
Average Home Value in this Area
Purchase History
| Date | Buyer | Sale Price | Title Company |
|---|---|---|---|
| G Properties Llc | $140,000 | None Listed On Document | |
| Byrd S Nest Llc | -- | None Available | |
| Byrd James A | $100,000 | -- |
Source: Public Records
Mortgage History
| Date | Status | Borrower | Loan Amount |
|---|---|---|---|
| Open | G Properties Llc | $230,000 |
Source: Public Records
Tax History Compared to Growth
Tax History
| Year | Tax Paid | Tax Assessment Tax Assessment Total Assessment is a certain percentage of the fair market value that is determined by local assessors to be the total taxable value of land and additions on the property. | Land | Improvement |
|---|---|---|---|---|
| 2024 | $1,239 | $33,600 | $3,500 | $30,100 |
| 2023 | $1,207 | $33,600 | $3,500 | $30,100 |
| 2022 | $1,195 | $33,600 | $3,500 | $30,100 |
| 2021 | $1,165 | $33,600 | $3,500 | $30,100 |
| 2020 | $1,131 | $33,600 | $3,500 | $30,100 |
| 2019 | $1,654 | $33,600 | $3,500 | $30,100 |
| 2018 | $966 | $33,600 | $3,500 | $30,100 |
| 2017 | $937 | $33,600 | $3,500 | $30,100 |
| 2016 | $935 | $33,600 | $3,500 | $30,100 |
| 2015 | $1,459 | $33,600 | $3,500 | $30,100 |
| 2014 | $1,459 | $33,600 | $3,500 | $30,100 |
Source: Public Records
Map
Nearby Homes