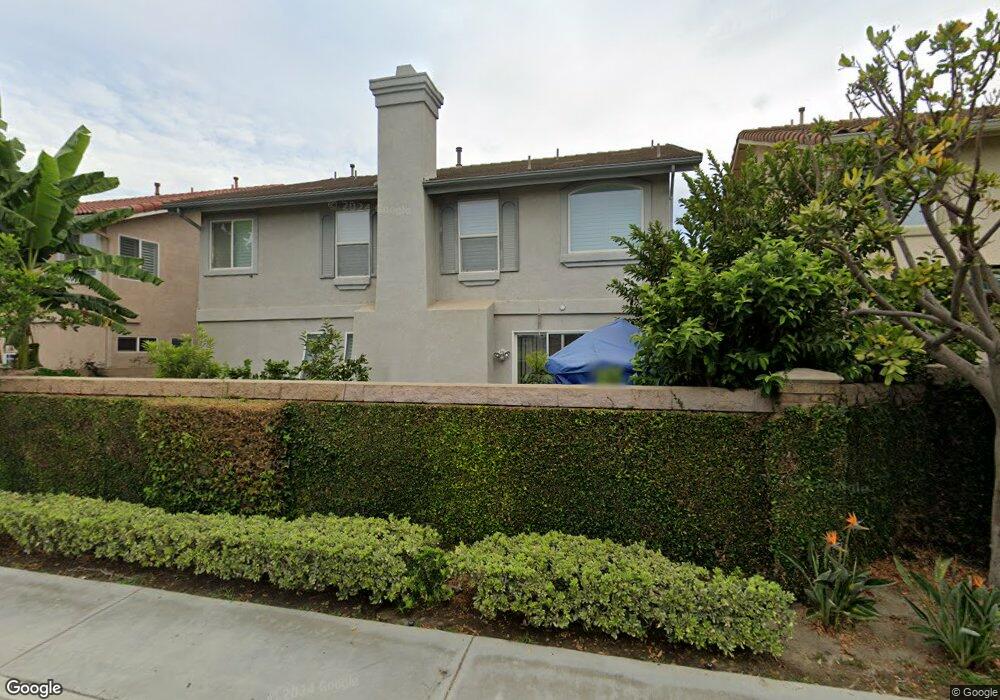
8277 Weber Ave Westminster, CA 92683
Estimated Value: $1,212,602 - $1,303,000
4
Beds
3
Baths
2,472
Sq Ft
$506/Sq Ft
Est. Value
About This Home
This home is located at 8277 Weber Ave, Westminster, CA 92683 and is currently estimated at $1,249,901, approximately $505 per square foot. 8277 Weber Ave is a home located in Orange County with nearby schools including Anderson Elementary School, Warner Middle, and Westminster High School.
Ownership History
Date
Name
Owned For
Owner Type
Purchase Details
Closed on
Aug 15, 2020
Sold by
Vantran Hau and Tran Kieu Oanh
Bought by
Vantran Hau and Truong Kieu Oanh
Current Estimated Value
Purchase Details
Closed on
Jun 26, 2016
Sold by
Nguyen Thu
Bought by
Tran Frank Hien
Home Financials for this Owner
Home Financials are based on the most recent Mortgage that was taken out on this home.
Original Mortgage
$439,000
Outstanding Balance
$351,131
Interest Rate
3.64%
Mortgage Type
New Conventional
Estimated Equity
$898,770
Purchase Details
Closed on
Jul 29, 2005
Sold by
Vanvantran Hau Van
Bought by
Vanvantran Hau Van and Truong Kieu Oanh Thi
Purchase Details
Closed on
Jun 22, 2004
Sold by
Westminster Towncenter Investors Llc
Bought by
Vantran Hau
Home Financials for this Owner
Home Financials are based on the most recent Mortgage that was taken out on this home.
Original Mortgage
$535,900
Interest Rate
6.62%
Mortgage Type
Purchase Money Mortgage
Create a Home Valuation Report for This Property
The Home Valuation Report is an in-depth analysis detailing your home's value as well as a comparison with similar homes in the area
Home Values in the Area
Average Home Value in this Area
Purchase History
| Date | Buyer | Sale Price | Title Company |
|---|---|---|---|
| Vantran Hau | -- | None Available | |
| Tran Frank Hien | -- | Provident Title Company | |
| Vantran Hau | -- | Provident Title Company | |
| Vanvantran Hau Van | -- | -- | |
| Vantran Hau | $670,000 | Orange Coast Title Company |
Source: Public Records
Mortgage History
| Date | Status | Borrower | Loan Amount |
|---|---|---|---|
| Open | Vantran Hau | $439,000 | |
| Closed | Vantran Hau | $535,900 |
Source: Public Records
Tax History Compared to Growth
Tax History
| Year | Tax Paid | Tax Assessment Tax Assessment Total Assessment is a certain percentage of the fair market value that is determined by local assessors to be the total taxable value of land and additions on the property. | Land | Improvement |
|---|---|---|---|---|
| 2025 | $10,921 | $945,470 | $537,723 | $407,747 |
| 2024 | $10,921 | $926,932 | $527,180 | $399,752 |
| 2023 | $10,000 | $858,516 | $501,513 | $357,003 |
| 2022 | $9,851 | $841,683 | $491,680 | $350,003 |
| 2021 | $9,618 | $825,180 | $482,039 | $343,141 |
| 2020 | $9,596 | $825,180 | $482,039 | $343,141 |
| 2019 | $9,484 | $809,000 | $472,587 | $336,413 |
| 2018 | $9,665 | $809,000 | $472,587 | $336,413 |
| 2017 | $8,747 | $743,849 | $437,456 | $306,393 |
| 2016 | $8,126 | $698,000 | $391,607 | $306,393 |
| 2015 | $7,113 | $607,000 | $300,607 | $306,393 |
| 2014 | $6,336 | $538,000 | $231,607 | $306,393 |
Source: Public Records
Map
Nearby Homes
- 8196 18th St
- 8202 19th St
- 13782 Newland St
- 14352 Beach Blvd Unit 127
- 14352 Beach Blvd Unit 41
- 8741 Jennrich Ave
- 7891 18th St
- 8784 Hewitt Place Unit 12
- 13911 Pacific Ave
- 8197 Jasmine Ave
- 8442 Trask Ave
- 14431 Nola St
- 14572 Purdy St
- 7821 10th St
- 13502 Jackson St
- 8902 Mcclure Ave
- 8866 Grandville Cir
- 14712 Newland St
- 14721 Riata St
- 13839 Magnolia St