Estimated Value: $843,697 - $1,086,000
3
Beds
2
Baths
1,914
Sq Ft
$504/Sq Ft
Est. Value
About This Home
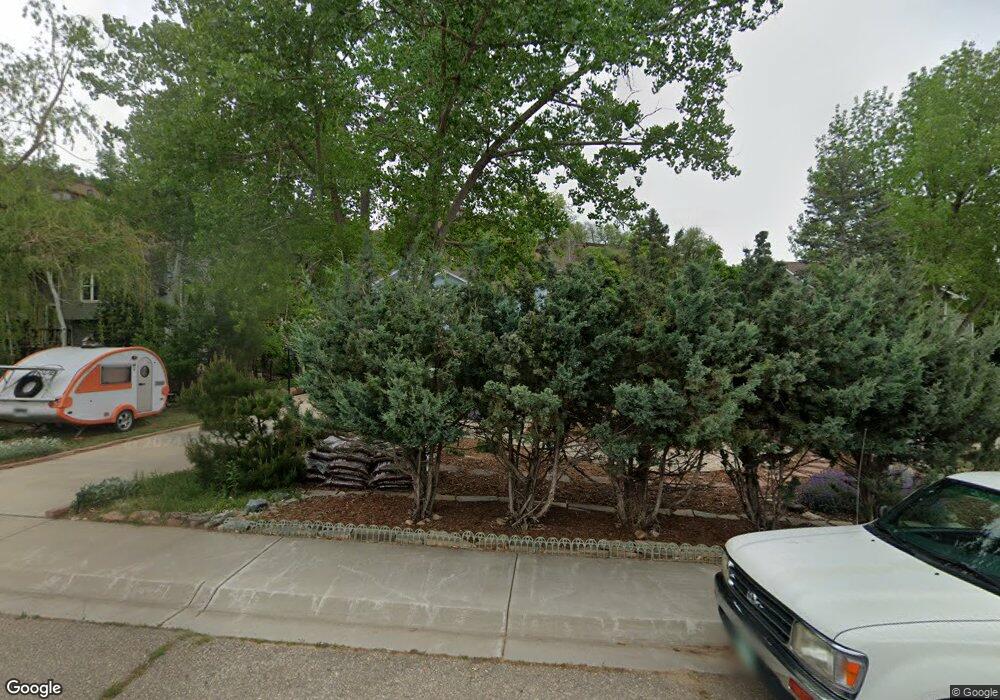
This home is located at 828 3rd Ave, Lyons, CO 80540 and is currently estimated at $964,424, approximately $503 per square foot. 828 3rd Ave is a home located in Boulder County with nearby schools including Lyons Elementary School and Lyons Middle/Senior High School.
Ownership History
Date
Name
Owned For
Owner Type
Purchase Details
Closed on
Aug 1, 2002
Sold by
Mitchell Gary Ross
Bought by
Mitchell Gary Ross
Current Estimated Value
Home Financials for this Owner
Home Financials are based on the most recent Mortgage that was taken out on this home.
Original Mortgage
$192,000
Interest Rate
6.53%
Purchase Details
Closed on
Aug 24, 2000
Sold by
Vigil Daniel A
Bought by
Vigil Daniel A and Cartier Claudia
Purchase Details
Closed on
Jan 18, 2000
Sold by
Vigil Daniel A
Bought by
Vigil Daniel
Purchase Details
Closed on
Sep 22, 1995
Sold by
Mike Folda Construction Inc
Bought by
Vigil Daniel A
Home Financials for this Owner
Home Financials are based on the most recent Mortgage that was taken out on this home.
Original Mortgage
$138,000
Interest Rate
7.77%
Purchase Details
Closed on
Sep 29, 1994
Sold by
Connor Jonathan F
Bought by
Folda Michael E
Create a Home Valuation Report for This Property
The Home Valuation Report is an in-depth analysis detailing your home's value as well as a comparison with similar homes in the area
Purchase History
| Date | Buyer | Sale Price | Title Company |
|---|---|---|---|
| Mitchell Gary Ross | -- | -- | |
| Mitchell Gary Ross | $397,000 | -- | |
| Vigil Daniel A | -- | -- | |
| Vigil Daniel | -- | -- | |
| Vigil Daniel A | $187,971 | -- | |
| Mike Folda Construction Inc | -- | -- | |
| Folda Michael E | -- | -- |
Source: Public Records
Mortgage History
| Date | Status | Borrower | Loan Amount |
|---|---|---|---|
| Closed | Mitchell Gary Ross | $192,000 | |
| Previous Owner | Vigil Daniel A | $138,000 |
Source: Public Records
Tax History
| Year | Tax Paid | Tax Assessment Tax Assessment Total Assessment is a certain percentage of the fair market value that is determined by local assessors to be the total taxable value of land and additions on the property. | Land | Improvement |
|---|---|---|---|---|
| 2025 | $5,412 | $50,482 | $5,444 | $45,038 |
| 2024 | $5,412 | $50,482 | $5,444 | $45,038 |
| 2023 | $5,339 | $52,206 | $5,059 | $50,833 |
| 2022 | $4,358 | $42,298 | $4,629 | $37,669 |
| 2021 | $4,305 | $43,515 | $4,762 | $38,753 |
| 2020 | $3,533 | $36,715 | $12,155 | $24,560 |
| 2019 | $3,462 | $36,715 | $12,155 | $24,560 |
| 2018 | $3,773 | $32,861 | $12,240 | $20,621 |
| 2017 | $3,711 | $36,329 | $13,532 | $22,797 |
| 2016 | $3,439 | $29,651 | $12,099 | $17,552 |
| 2015 | $3,270 | $27,860 | $8,756 | $19,104 |
| 2014 | $2,888 | $27,860 | $8,756 | $19,104 |
Source: Public Records
Map
Nearby Homes
- 125 Longs Peak Dr
- 1040 5th Ave 2 and 4
- 1040 5th Ave 5
- 618 Overlook Dr
- 17667 Route 7
- 18673 Route 7
- 1117 5th Ave
- 1117 N 5th Ave
- 342 4th Ave
- 0 Apple Valley Rd
- 2615 Eagle Ridge Rd
- 223 Stone Canyon Rd
- 121 Osprey Ln
- 119 Eagle Canyon Cir
- 2685 Eagle Ridge Rd
- 350 Mcconnell Dr
- 104 Noland Ct
- 1285 Eagle Ridge Rd
- 430 Carter Dr
- 1669 Apple Valley Rd
Your Personal Tour Guide
Ask me questions while you tour the home.