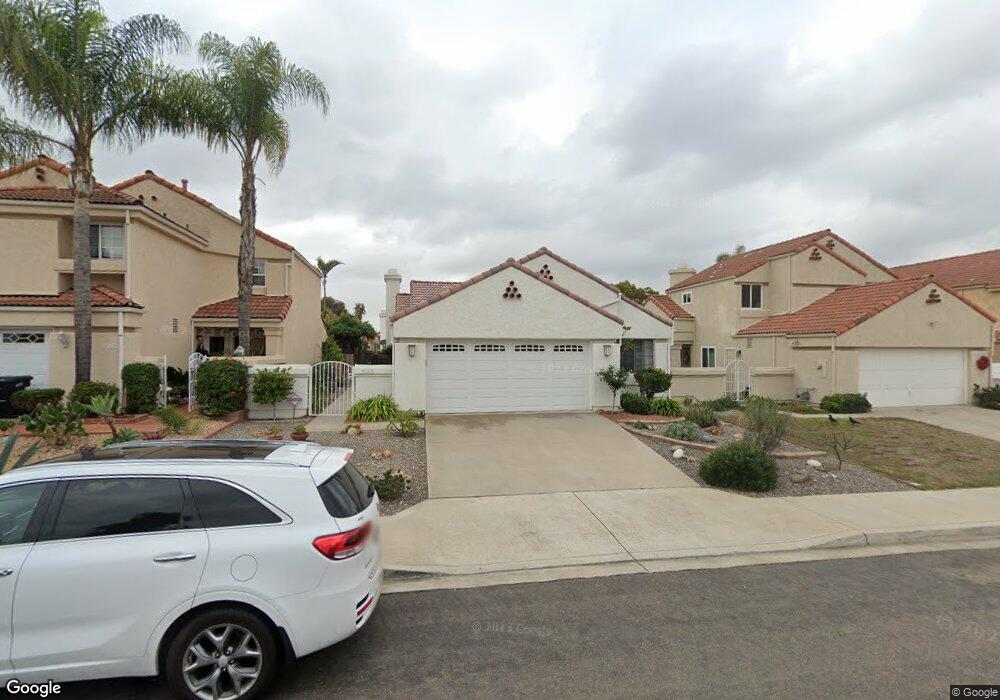
828 Cedarbend Way Chula Vista, CA 91910
Rancho Del Rey NeighborhoodEstimated Value: $796,140 - $889,000
3
Beds
2
Baths
1,458
Sq Ft
$573/Sq Ft
Est. Value
About This Home
This home is located at 828 Cedarbend Way, Chula Vista, CA 91910 and is currently estimated at $834,785, approximately $572 per square foot. 828 Cedarbend Way is a home located in San Diego County with nearby schools including Casillas Elementary School, Rancho Del Rey Middle School, and Otay Ranch Senior High School.
Ownership History
Date
Name
Owned For
Owner Type
Purchase Details
Closed on
Dec 29, 2011
Sold by
Yaggie Norman R and Tibbitts Ilene
Bought by
Yaggie Norman R and Tibbitts Ilene
Current Estimated Value
Home Financials for this Owner
Home Financials are based on the most recent Mortgage that was taken out on this home.
Original Mortgage
$75,000
Interest Rate
3.91%
Mortgage Type
New Conventional
Purchase Details
Closed on
May 26, 2011
Sold by
Yaggie Norman R and Tibbitts Ilene
Bought by
Yaggie Norman R and Tibbitts Ilene
Purchase Details
Closed on
Oct 4, 2002
Sold by
Yaggie Norman R
Bought by
Yaggie Norman R
Home Financials for this Owner
Home Financials are based on the most recent Mortgage that was taken out on this home.
Original Mortgage
$120,000
Interest Rate
6.22%
Purchase Details
Closed on
Sep 6, 2002
Sold by
Yaggie Norman R
Bought by
Yaggie Norman R
Home Financials for this Owner
Home Financials are based on the most recent Mortgage that was taken out on this home.
Original Mortgage
$120,000
Interest Rate
6.22%
Purchase Details
Closed on
Aug 24, 2000
Sold by
Yaggie Norman R
Bought by
Yaggie Norman R
Purchase Details
Closed on
May 20, 1987
Purchase Details
Closed on
Oct 22, 1984
Create a Home Valuation Report for This Property
The Home Valuation Report is an in-depth analysis detailing your home's value as well as a comparison with similar homes in the area
Home Values in the Area
Average Home Value in this Area
Purchase History
| Date | Buyer | Sale Price | Title Company |
|---|---|---|---|
| Yaggie Norman R | -- | Stewart Title Of California | |
| Yaggie Norman R | -- | Accommodation | |
| Yaggie Norman R | -- | None Available | |
| Yaggie Norman R | -- | None Available | |
| Yaggie Norman R | -- | -- | |
| Yaggie Norman R | -- | Lawyers Title | |
| Yaggie Norman R | -- | -- | |
| -- | $145,000 | -- | |
| -- | $110,900 | -- |
Source: Public Records
Mortgage History
| Date | Status | Borrower | Loan Amount |
|---|---|---|---|
| Closed | Yaggie Norman R | $75,000 | |
| Closed | Yaggie Norman R | $120,000 |
Source: Public Records
Tax History Compared to Growth
Tax History
| Year | Tax Paid | Tax Assessment Tax Assessment Total Assessment is a certain percentage of the fair market value that is determined by local assessors to be the total taxable value of land and additions on the property. | Land | Improvement |
|---|---|---|---|---|
| 2025 | $3,381 | $283,048 | $96,978 | $186,070 |
| 2024 | $3,381 | $277,499 | $95,077 | $182,422 |
| 2023 | $3,330 | $272,059 | $93,213 | $178,846 |
| 2022 | $3,232 | $266,726 | $91,386 | $175,340 |
| 2021 | $3,159 | $261,497 | $89,595 | $171,902 |
| 2020 | $3,085 | $258,817 | $88,677 | $170,140 |
| 2019 | $3,006 | $253,743 | $86,939 | $166,804 |
| 2018 | $2,956 | $248,769 | $85,235 | $163,534 |
| 2017 | $2,892 | $243,892 | $83,564 | $160,328 |
| 2016 | $2,816 | $239,111 | $81,926 | $157,185 |
| 2015 | $2,775 | $235,520 | $80,696 | $154,824 |
| 2014 | $2,716 | $230,908 | $79,116 | $151,792 |
Source: Public Records
Map
Nearby Homes
- 1002 Cholla Place
- 1029 Vista Oak Place
- 820 Chervil Ct
- 694 Calma Place
- 1008 Calma Dr
- 843 Calle Ciela Vista Unit 20
- 1057 Paseo Del Norte
- 626 Mariposa Cir
- 1060 Via Sinuoso
- 640 E J St
- 1112 Camino Del Rey
- 578 Nantucket Dr
- 793 Vada St Unit 2
- 713 Esla Dr
- 728 Cardona Ave
- 554 Telegraph Canyon Rd Unit F
- 491 Nanette St
- 486 E Naples St
- 548 Telegraph Canyon Rd Unit D
- 838 David Dr
- 826 Cedarbend Way
- 830 Cedarbend Way
- 824 Cedarbend Way
- 832 Cedarbend Way
- 937 Redbud Rd
- 935 Redbud Rd
- 939 Redbud Rd
- 820 Cedarbend Way
- 836 Cedarbend Way
- 933 Redbud Rd
- 941 Redbud Rd
- 827 Cedarbend Way
- 829 Cedarbend Way Unit B
- 931 Redbud Rd
- 831 Cedarbend Way
- 825 Cedarbend Way
- 818 Cedarbend Way
- 943 Redbud Rd Unit B
- 838 Cedarbend Way
- 823 Cedarbend Way