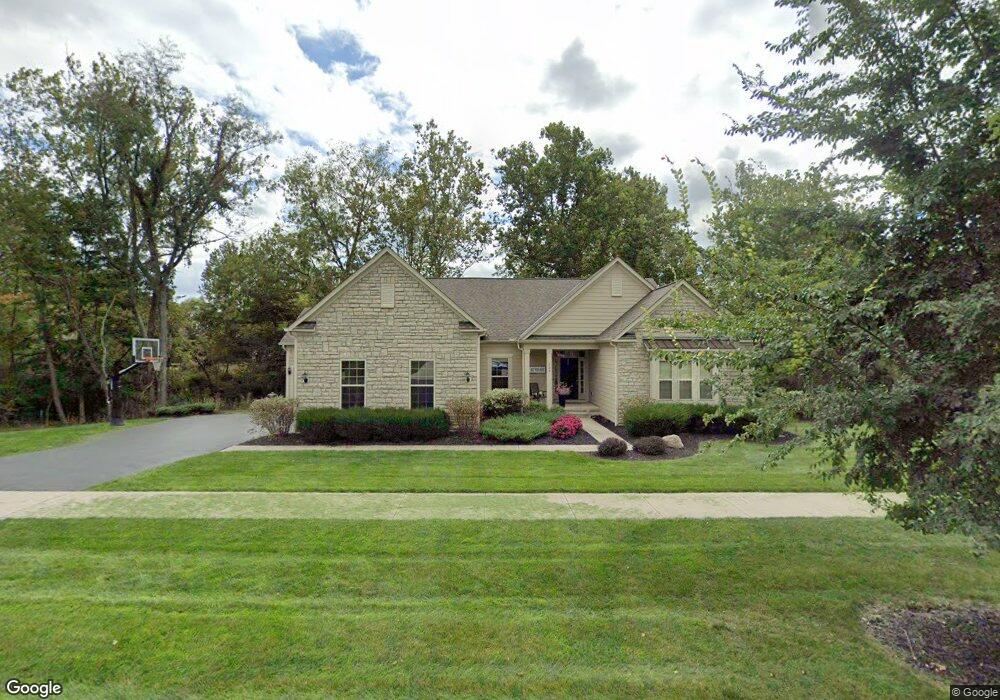
828 Elderberry Loop Unit OLF4924 Delaware, OH 43015
Estimated Value: $673,000 - $832,000
3
Beds
2
Baths
2,952
Sq Ft
$261/Sq Ft
Est. Value
About This Home
This home is located at 828 Elderberry Loop Unit OLF4924, Delaware, OH 43015 and is currently estimated at $770,781, approximately $261 per square foot. 828 Elderberry Loop Unit OLF4924 is a home located in Delaware County with nearby schools including Heritage Elementary School, Olentangy Shanahan Middle School, and Olentangy High School.
Ownership History
Date
Name
Owned For
Owner Type
Purchase Details
Closed on
Mar 7, 2014
Sold by
Rockford Homes Inc
Bought by
Thomas Garrick T and Rampe Molly A
Current Estimated Value
Home Financials for this Owner
Home Financials are based on the most recent Mortgage that was taken out on this home.
Original Mortgage
$376,844
Outstanding Balance
$286,176
Interest Rate
4.39%
Mortgage Type
New Conventional
Estimated Equity
$484,605
Purchase Details
Closed on
Jul 23, 2013
Sold by
Crown Ridge Investments Llc
Bought by
Rockford Homes Inc
Home Financials for this Owner
Home Financials are based on the most recent Mortgage that was taken out on this home.
Original Mortgage
$287,230
Interest Rate
4.02%
Mortgage Type
Future Advance Clause Open End Mortgage
Create a Home Valuation Report for This Property
The Home Valuation Report is an in-depth analysis detailing your home's value as well as a comparison with similar homes in the area
Home Values in the Area
Average Home Value in this Area
Purchase History
| Date | Buyer | Sale Price | Title Company |
|---|---|---|---|
| Thomas Garrick T | $418,800 | Title First Box | |
| Rockford Homes Inc | -- | None Available |
Source: Public Records
Mortgage History
| Date | Status | Borrower | Loan Amount |
|---|---|---|---|
| Open | Thomas Garrick T | $376,844 | |
| Previous Owner | Rockford Homes Inc | $287,230 |
Source: Public Records
Tax History
| Year | Tax Paid | Tax Assessment Tax Assessment Total Assessment is a certain percentage of the fair market value that is determined by local assessors to be the total taxable value of land and additions on the property. | Land | Improvement |
|---|---|---|---|---|
| 2024 | $11,870 | $224,700 | $50,750 | $173,950 |
| 2023 | $11,916 | $224,700 | $50,750 | $173,950 |
| 2022 | $11,191 | $167,230 | $38,500 | $128,730 |
| 2021 | $11,259 | $167,230 | $38,500 | $128,730 |
| 2020 | $11,313 | $167,230 | $38,500 | $128,730 |
| 2019 | $10,615 | $163,490 | $38,500 | $124,990 |
| 2018 | $10,650 | $163,490 | $38,500 | $124,990 |
| 2017 | $9,620 | $138,950 | $33,250 | $105,700 |
| 2016 | $9,629 | $138,950 | $33,250 | $105,700 |
| 2015 | $8,714 | $138,950 | $33,250 | $105,700 |
| 2014 | $7,189 | $106,750 | $33,250 | $73,500 |
| 2013 | $2,168 | $31,610 | $31,610 | $0 |
Source: Public Records
Map
Nearby Homes
- 820 Alicia Kelton Dr
- 549 Alicia Kelton Dr
- 521 Alicia Kelton Dr
- 986 Lale Point
- 634 Alicia Kelton Dr
- 5962 Laurel Ln
- 5470 Green Castle Ct
- 5443 Green Castle Ct
- 545 Fadley Loop E
- 5512 Green Castle Ct
- 5503 Green Castle Ct
- 5833 Benton Ln
- 5547 Green Castle Ct
- 6334 Artesian Run
- 5230 Cypress Dr
- 285 Walnut Blvd
- 6427 Longview Dr
- 166 Split Log Pass
- 4916 Olentangy River Rd
- 6505 Longview Dr
- 828 Elderberry Loop Unit OF4924
- 960 Elderberry Loop
- 916 Elderberry Loop
- 796 Elderberry Loop
- 851 Elderberry Loop Unit OLF4894
- 851 Elderberry Loop
- 825 Elderberry Loop
- 992 Elderberry Loop
- 795 Elderberry Loop
- 909 Elderberry Loop
- 883 Elderberry Loop
- 1020 Elderberry Loop
- 768 Elderberry Loop
- 768 Elderberry Loop Unit OLF4922
- 867 Elderberry Loop
- 867 Elderberry Loop Unit OF4895
- 949 Elderberry Loop
- 949 Elderberry Loop Unit OLF4899
- 981 Elderberry Loop
- 929 Elderberry Loop
Your Personal Tour Guide
Ask me questions while you tour the home.