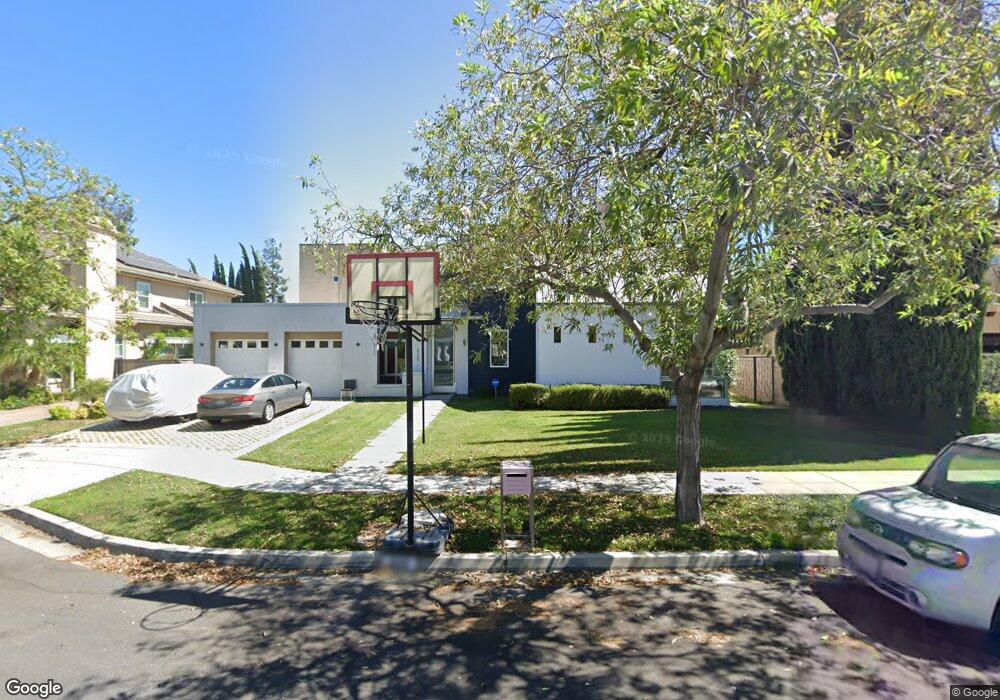
828 Pamela Place Arcadia, CA 91006
Estimated Value: $1,952,000 - $3,079,000
4
Beds
5
Baths
4,353
Sq Ft
$549/Sq Ft
Est. Value
About This Home
This home is located at 828 Pamela Place, Arcadia, CA 91006 and is currently estimated at $2,390,056, approximately $549 per square foot. 828 Pamela Place is a home located in Los Angeles County with nearby schools including Camino Grove Elementary School, Richard Henry Dana Middle School, and Arcadia High School.
Ownership History
Date
Name
Owned For
Owner Type
Purchase Details
Closed on
Aug 10, 2016
Sold by
Yang Scott S
Bought by
Yang Scott S and Shih Lynn Yu
Current Estimated Value
Home Financials for this Owner
Home Financials are based on the most recent Mortgage that was taken out on this home.
Original Mortgage
$511,000
Outstanding Balance
$417,544
Interest Rate
4.25%
Mortgage Type
Adjustable Rate Mortgage/ARM
Estimated Equity
$1,972,512
Purchase Details
Closed on
Oct 20, 2004
Sold by
Shih Lynn Y
Bought by
Yang Scott S
Home Financials for this Owner
Home Financials are based on the most recent Mortgage that was taken out on this home.
Original Mortgage
$600,000
Interest Rate
5.7%
Mortgage Type
Construction
Purchase Details
Closed on
Oct 8, 2004
Sold by
Polyco Llc
Bought by
Yang Scott S
Home Financials for this Owner
Home Financials are based on the most recent Mortgage that was taken out on this home.
Original Mortgage
$600,000
Interest Rate
5.7%
Mortgage Type
Construction
Create a Home Valuation Report for This Property
The Home Valuation Report is an in-depth analysis detailing your home's value as well as a comparison with similar homes in the area
Home Values in the Area
Average Home Value in this Area
Purchase History
| Date | Buyer | Sale Price | Title Company |
|---|---|---|---|
| Yang Scott S | -- | Chicago Title Company | |
| Yang Scott S | -- | Fidelity National Title Comp | |
| Yang Scott S | $389,000 | Fidelity National Title Comp |
Source: Public Records
Mortgage History
| Date | Status | Borrower | Loan Amount |
|---|---|---|---|
| Open | Yang Scott S | $511,000 | |
| Closed | Yang Scott S | $600,000 |
Source: Public Records
Tax History Compared to Growth
Tax History
| Year | Tax Paid | Tax Assessment Tax Assessment Total Assessment is a certain percentage of the fair market value that is determined by local assessors to be the total taxable value of land and additions on the property. | Land | Improvement |
|---|---|---|---|---|
| 2025 | $13,382 | $1,185,195 | $542,225 | $642,970 |
| 2024 | $13,382 | $1,161,957 | $531,594 | $630,363 |
| 2023 | $13,108 | $1,139,174 | $521,171 | $618,003 |
| 2022 | $12,679 | $1,116,838 | $510,952 | $605,886 |
| 2021 | $12,436 | $1,094,940 | $500,934 | $594,006 |
| 2019 | $12,137 | $1,062,466 | $486,077 | $576,389 |
| 2018 | $11,808 | $1,041,635 | $476,547 | $565,088 |
| 2016 | $11,510 | $1,001,189 | $458,043 | $543,146 |
| 2015 | $11,314 | $986,151 | $451,163 | $534,988 |
| 2014 | $11,162 | $966,835 | $442,326 | $524,509 |
Source: Public Records
Map
Nearby Homes
- 1420 Linda Way
- 1429 S 8th Ave
- 811 E Norman Ave
- 1101 E Camino Real Ave
- 1821 Tulip Ln
- 1624 S 6th Ave
- 1431 S 6th Ave
- 1610 Mayflower Ave
- 416 Jeffries Ave Unit 8
- 416 Jeffries Ave Unit 60
- 1118 S 6th Ave
- 2647 Doolittle Ave
- 1924 S 6th Ave
- 2632 S 10th Ave
- 312 E Camino Real Ave
- 1935 S 6th Ave
- 240 W El Sur St
- 1118 S 4th Ave
- 1032 El Norte Ave
- 916 Othello St
- 818 Pamela Place
- 838 Pamela Place
- 821 E Camino Real Ave
- 808 Pamela Place
- 829 E Camino Real Ave
- 815 E Camino Real Ave
- 829 Pamela Place
- 823 E Camino Real Ave
- 839 Pamela Place
- 819 Pamela Place
- 1520 S 8th Ave
- 809 Pamela Place
- 1518 S 8th Ave
- 1433 Linda Way
- 809 E Camino Real Ave
- 901 E Camino Real Ave
- 803 Pamela Place
- 1530 S 8th Ave
- 1428 S 8th Ave
- 905 E Camino Real Ave