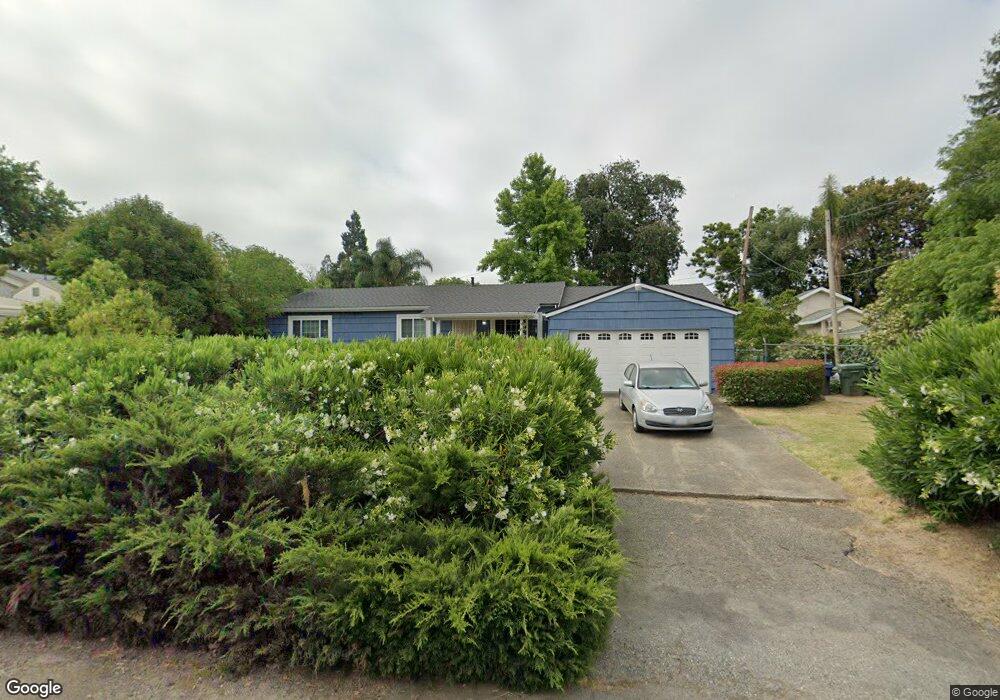
8280 Beehive Ct Fair Oaks, CA 95628
Estimated Value: $395,880 - $438,000
3
Beds
1
Bath
960
Sq Ft
$444/Sq Ft
Est. Value
About This Home
This home is located at 8280 Beehive Ct, Fair Oaks, CA 95628 and is currently estimated at $426,220, approximately $443 per square foot. 8280 Beehive Ct is a home located in Sacramento County with nearby schools including Northridge Elementary School, Andrew Carnegie Middle School, and Bella Vista High School.
Ownership History
Date
Name
Owned For
Owner Type
Purchase Details
Closed on
Aug 20, 2019
Sold by
Sullivan Robert B and Sullivan Paula Michelle
Bought by
Sullivan Robert B and Sullivan Living Trust
Current Estimated Value
Purchase Details
Closed on
Apr 7, 1998
Sold by
Miche Snyder Roxanne Phoebe and Austin Paul
Bought by
Sullivan Robert B and Sullivan Paula Michelle
Home Financials for this Owner
Home Financials are based on the most recent Mortgage that was taken out on this home.
Original Mortgage
$70,000
Outstanding Balance
$13,253
Interest Rate
7.07%
Estimated Equity
$412,967
Purchase Details
Closed on
Nov 14, 1997
Sold by
Snyder Roxanne Phoebe
Bought by
Snyder Roxanne P and Roxanne P Snyder Trust
Purchase Details
Closed on
Dec 17, 1996
Sold by
Snyder Roxanne Phoebe
Bought by
Snyder Roxanne P and Austin Paula Michelle
Purchase Details
Closed on
Sep 11, 1996
Sold by
Snyder Roxanne P
Bought by
Snyder Roxanne P and Roxanne P Snyder Living Trust
Create a Home Valuation Report for This Property
The Home Valuation Report is an in-depth analysis detailing your home's value as well as a comparison with similar homes in the area
Home Values in the Area
Average Home Value in this Area
Purchase History
| Date | Buyer | Sale Price | Title Company |
|---|---|---|---|
| Sullivan Robert B | -- | None Available | |
| Sullivan Robert B | $20,000 | Commonwealth Land Title Ins | |
| Snyder Roxanne P | -- | -- | |
| Snyder Roxanne P | -- | -- | |
| Snyder Roxanne P | -- | -- | |
| Snyder Roxanne P | -- | -- |
Source: Public Records
Mortgage History
| Date | Status | Borrower | Loan Amount |
|---|---|---|---|
| Open | Sullivan Robert B | $70,000 |
Source: Public Records
Tax History
| Year | Tax Paid | Tax Assessment Tax Assessment Total Assessment is a certain percentage of the fair market value that is determined by local assessors to be the total taxable value of land and additions on the property. | Land | Improvement |
|---|---|---|---|---|
| 2025 | $1,825 | $154,855 | $63,853 | $91,002 |
| 2024 | $1,825 | $151,819 | $62,601 | $89,218 |
| 2023 | $1,770 | $148,843 | $61,374 | $87,469 |
| 2022 | $1,761 | $145,925 | $60,171 | $85,754 |
| 2021 | $1,726 | $143,065 | $58,992 | $84,073 |
| 2020 | $1,700 | $141,599 | $58,388 | $83,211 |
| 2019 | $1,655 | $138,824 | $57,244 | $81,580 |
| 2018 | $1,617 | $136,103 | $56,122 | $79,981 |
| 2017 | $1,599 | $133,435 | $55,022 | $78,413 |
| 2016 | $1,494 | $130,820 | $53,944 | $76,876 |
| 2015 | $1,467 | $128,856 | $53,134 | $75,722 |
| 2014 | $1,435 | $126,333 | $52,094 | $74,239 |
Source: Public Records
Map
Nearby Homes
- 5343 Maui Way
- 8169 Chenin Blanc Ln
- 8366 Madison Ave
- 8255 Oahu Dr
- 8142 Treecrest Ave
- 8112 Red Sherry Ln
- 5233 Buena Vista Ave
- 8226 Econ Ct
- 8450 Wattle Way
- 8451 Wattle Way
- 8454 Wattle Way
- 5542 Kamala Way
- 8458 Wattle Way
- 8462 Wattle Way
- 5555 Kamala Way
- 8463 Wattle Way
- 8466 Wattle Way
- 8470 Wattle Way
- 8474 Wattle Way
- 5453 Ventana Place
- 5441 Mckay St
- 8274 Beehive Ct
- 5433 Buena Ventura Way
- 5431 Mckay St
- 8268 Beehive Ct
- 8281 Beehive Ct
- 8275 Beehive Ct
- 5501 Mckay St
- 5429 Buena Ventura Way
- 5437 Buena Ventura Way
- 5423 Mckay St
- 8269 Beehive Ct
- 5440 Mckay St
- 8262 Beehive Ct
- 5448 Mckay St
- 5432 Mckay St
- 5425 Buena Ventura Way
- 5500 Mckay St
- 5415 Mckay St
- 8288 Deseret Ave
Your Personal Tour Guide
Ask me questions while you tour the home.