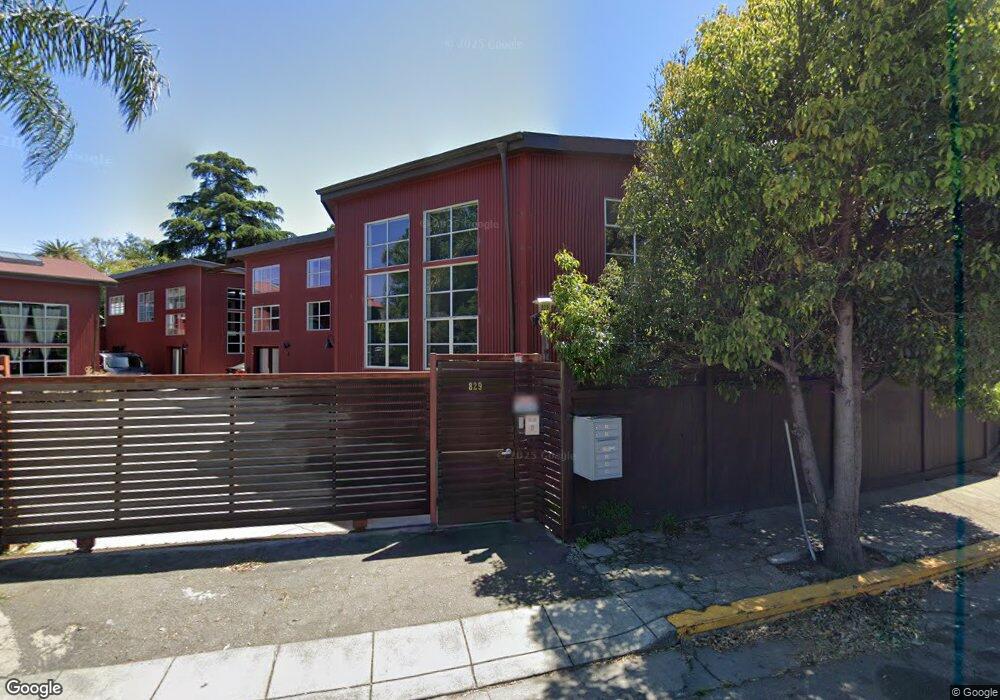
829 21st St Unit 1 Oakland, CA 94607
West Oakland NeighborhoodEstimated Value: $579,000 - $771,000
1
Bed
2
Baths
1,546
Sq Ft
$426/Sq Ft
Est. Value
About This Home
This home is located at 829 21st St Unit 1, Oakland, CA 94607 and is currently estimated at $658,715, approximately $426 per square foot. 829 21st St Unit 1 is a home located in Alameda County with nearby schools including M. L. King Jr. Elementary School, West Oakland Middle School, and McClymonds High School.
Ownership History
Date
Name
Owned For
Owner Type
Purchase Details
Closed on
Jun 22, 2021
Sold by
Gordon Eric S and Gordon Catherine L
Bought by
Gordon Eric S and Gordon Catherine L
Current Estimated Value
Purchase Details
Closed on
Aug 18, 2011
Sold by
Chinn & Jenkins Investments Llc
Bought by
Gordon Eric S and Gordon Catherine L
Home Financials for this Owner
Home Financials are based on the most recent Mortgage that was taken out on this home.
Original Mortgage
$199,000
Outstanding Balance
$16,304
Interest Rate
4.43%
Mortgage Type
New Conventional
Estimated Equity
$642,411
Create a Home Valuation Report for This Property
The Home Valuation Report is an in-depth analysis detailing your home's value as well as a comparison with similar homes in the area
Home Values in the Area
Average Home Value in this Area
Purchase History
| Date | Buyer | Sale Price | Title Company |
|---|---|---|---|
| Gordon Eric S | -- | None Available | |
| Gordon Eric S | $349,000 | Old Republic Title Company |
Source: Public Records
Mortgage History
| Date | Status | Borrower | Loan Amount |
|---|---|---|---|
| Open | Gordon Eric S | $199,000 |
Source: Public Records
Tax History Compared to Growth
Tax History
| Year | Tax Paid | Tax Assessment Tax Assessment Total Assessment is a certain percentage of the fair market value that is determined by local assessors to be the total taxable value of land and additions on the property. | Land | Improvement |
|---|---|---|---|---|
| 2025 | $7,125 | $431,340 | $131,502 | $306,838 |
| 2024 | $7,125 | $422,747 | $128,924 | $300,823 |
| 2023 | $7,432 | $421,322 | $126,396 | $294,926 |
| 2022 | $7,208 | $406,061 | $123,918 | $289,143 |
| 2021 | $6,834 | $397,964 | $121,489 | $283,475 |
| 2020 | $6,757 | $400,815 | $120,244 | $280,571 |
| 2019 | $6,466 | $392,960 | $117,888 | $275,072 |
| 2018 | $6,331 | $385,257 | $115,577 | $269,680 |
| 2017 | $6,074 | $377,704 | $113,311 | $264,393 |
| 2016 | $5,837 | $370,298 | $111,089 | $259,209 |
| 2015 | $5,804 | $364,738 | $109,421 | $255,317 |
| 2014 | $5,835 | $357,595 | $107,278 | $250,317 |
Source: Public Records
Map
Nearby Homes
- 881 21st St
- 1915 West St
- 2112 West St Unit 2
- 861 W Grand Ave
- 850 W Grand Ave Unit 6
- 2103 Myrtle St
- 2311 San Pablo Ave
- 2327 San Pablo Ave
- 878 Athens Ave
- 2621 Market St
- 710 24th St
- 734 25th St
- 2521 San Pablo Ave
- 1424 Market St
- 630 Thomas L Berkley Way Unit 102
- 2505 Market St
- 603 22nd St
- 595 22nd St Unit 595
- 2530 Market St
- 729 26th St