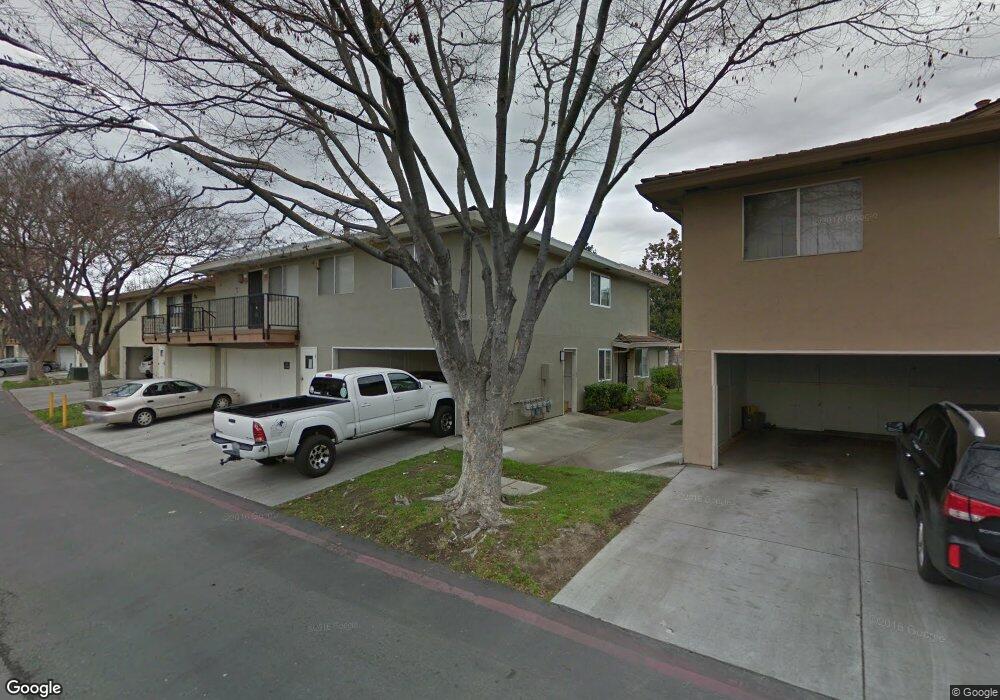
829 N Capitol Ave Unit 4 San Jose, CA 95133
Penitencia NeighborhoodEstimated Value: $455,790 - $518,000
2
Beds
1
Bath
798
Sq Ft
$606/Sq Ft
Est. Value
About This Home
This home is located at 829 N Capitol Ave Unit 4, San Jose, CA 95133 and is currently estimated at $483,198, approximately $605 per square foot. 829 N Capitol Ave Unit 4 is a home located in Santa Clara County with nearby schools including Summerdale Elementary School, Piedmont Middle School, and Independence High School.
Ownership History
Date
Name
Owned For
Owner Type
Purchase Details
Closed on
Dec 9, 2010
Sold by
Chen Ming L
Bought by
Chen Tai Wai
Current Estimated Value
Purchase Details
Closed on
Nov 26, 2010
Sold by
Deutsche Bank National Trust Company
Bought by
Chen Sui Tak Robert and Chen Tai Wai
Purchase Details
Closed on
Jan 8, 2010
Sold by
Morales Mariela
Bought by
Deutsche Bank National Trust Company
Purchase Details
Closed on
Mar 6, 2006
Sold by
Martinez Carlos
Bought by
Morales Mariela
Home Financials for this Owner
Home Financials are based on the most recent Mortgage that was taken out on this home.
Original Mortgage
$72,000
Interest Rate
6.19%
Mortgage Type
Stand Alone Second
Purchase Details
Closed on
Feb 1, 2006
Sold by
Pioli Ed G and Dolores Pioli M
Bought by
Morales Mariela
Home Financials for this Owner
Home Financials are based on the most recent Mortgage that was taken out on this home.
Original Mortgage
$72,000
Interest Rate
6.19%
Mortgage Type
Stand Alone Second
Create a Home Valuation Report for This Property
The Home Valuation Report is an in-depth analysis detailing your home's value as well as a comparison with similar homes in the area
Home Values in the Area
Average Home Value in this Area
Purchase History
| Date | Buyer | Sale Price | Title Company |
|---|---|---|---|
| Chen Tai Wai | -- | Lsi Title Company | |
| Chen Sui Tak Robert | -- | Lsi Title Company | |
| Chen Sui Tak Robert | $140,000 | Lsi Title Company | |
| Deutsche Bank National Trust Company | $290,000 | Accommodation | |
| Morales Mariela | -- | Financial Title Company | |
| Morales Mariela | $360,000 | Financial Title Company |
Source: Public Records
Mortgage History
| Date | Status | Borrower | Loan Amount |
|---|---|---|---|
| Previous Owner | Morales Mariela | $72,000 | |
| Previous Owner | Morales Mariela | $288,000 | |
| Previous Owner | Morales Mariela | $288,000 |
Source: Public Records
Tax History Compared to Growth
Tax History
| Year | Tax Paid | Tax Assessment Tax Assessment Total Assessment is a certain percentage of the fair market value that is determined by local assessors to be the total taxable value of land and additions on the property. | Land | Improvement |
|---|---|---|---|---|
| 2025 | $2,881 | $179,354 | $107,613 | $71,741 |
| 2024 | $2,881 | $175,838 | $105,503 | $70,335 |
| 2023 | $2,818 | $172,391 | $103,435 | $68,956 |
| 2022 | $2,818 | $169,011 | $101,407 | $67,604 |
| 2021 | $2,726 | $165,698 | $99,419 | $66,279 |
| 2020 | $2,668 | $164,000 | $98,400 | $65,600 |
| 2019 | $2,579 | $160,785 | $96,471 | $64,314 |
| 2018 | $2,545 | $157,633 | $94,580 | $63,053 |
| 2017 | $2,555 | $154,543 | $92,726 | $61,817 |
| 2016 | $2,442 | $151,513 | $90,908 | $60,605 |
| 2015 | $2,406 | $149,238 | $89,543 | $59,695 |
| 2014 | $2,269 | $146,315 | $87,789 | $58,526 |
Source: Public Records
Map
Nearby Homes
- 825 N Capitol Ave Unit 4
- 981 Harcot Ct
- 985 Harcot Ct
- 990 Harcot Ct
- 997 Harcot Ct
- 994 Harcot Ct
- 982 Harcot Ct
- 970 E Harcot Ct
- 998 Harcot Ct
- Residence 2 Plan at Ascend
- Residence 1 Plan at Ascend
- Residence 3 Plan at Ascend
- 2714 Mabury Square
- 1055 N Capitol Ave Unit 124
- 1055 N Capitol Ave Unit 180
- 1055 N Capitol Ave Unit 51
- 714 N Capitol Ave
- 674 Galleon Ct
- 2806 Glauser Dr
- 709 Whitewater Ct Unit 44
- 829 N Capitol Ave Unit 3
- 829 N Capitol Ave Unit 2
- 829 N Capitol Ave Unit 1
- 827 N Capitol Ave Unit 4
- 827 N Capitol Ave Unit 3
- 827 N Capitol Ave Unit 2
- 827 N Capitol Ave Unit 1
- 831 N Capitol Ave Unit 3
- 831 N Capitol Ave Unit 4
- 831 N Capitol Ave Unit 3
- 831 N Capitol Ave Unit 2
- 831 N Capitol Ave Unit 1
- 833 N Capitol Ave Unit 3
- 833 N Capitol Ave Unit 4
- 833 N Capitol Ave Unit 3
- 833 N Capitol Ave Unit 2
- 833 N Capitol Ave Unit 1
- 894 Gilchrist Walkway
- 894 Gilchrist Walkway Unit 1
- 894 Gilchrist Walkway Unit 3