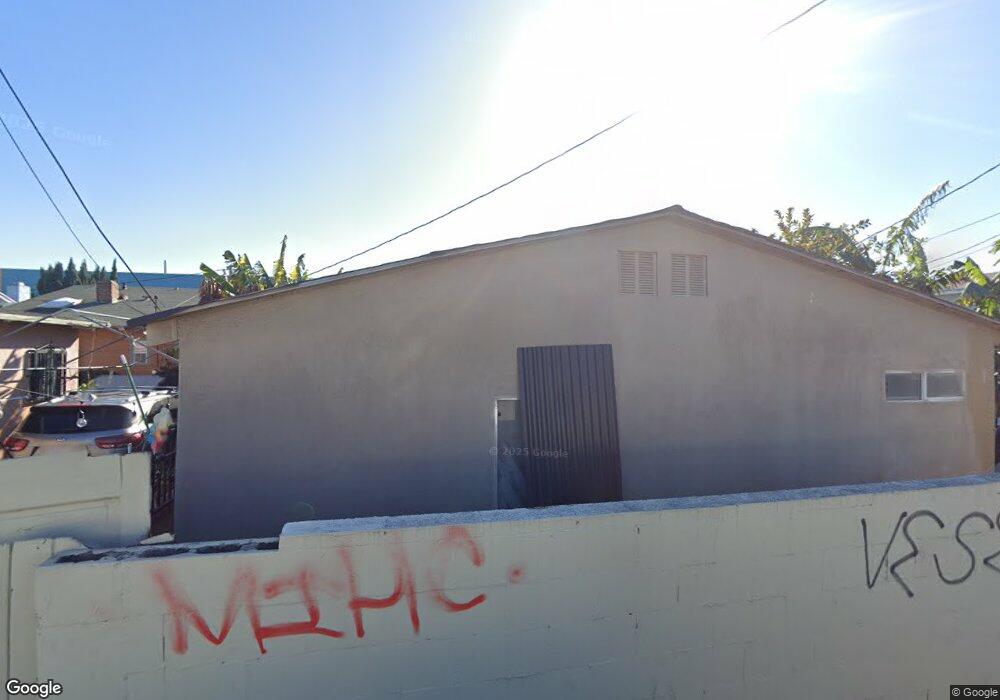
829 W 58th St Los Angeles, CA 90037
Vermont-Slauson NeighborhoodEstimated Value: $631,000 - $644,000
2
Beds
1
Bath
1,008
Sq Ft
$634/Sq Ft
Est. Value
About This Home
This home is located at 829 W 58th St, Los Angeles, CA 90037 and is currently estimated at $639,183, approximately $634 per square foot. 829 W 58th St is a home located in Los Angeles County with nearby schools including Fifty-Second Street Elementary School, John Muir Middle School, and Augustus F. Hawkins High A Critical Design And Gaming.
Ownership History
Date
Name
Owned For
Owner Type
Purchase Details
Closed on
Dec 20, 2000
Sold by
Brown Karen Bettina and Estate Of Joseph A Green
Bought by
Matute Jose A
Current Estimated Value
Home Financials for this Owner
Home Financials are based on the most recent Mortgage that was taken out on this home.
Original Mortgage
$80,800
Outstanding Balance
$29,797
Interest Rate
7.71%
Estimated Equity
$609,386
Create a Home Valuation Report for This Property
The Home Valuation Report is an in-depth analysis detailing your home's value as well as a comparison with similar homes in the area
Home Values in the Area
Average Home Value in this Area
Purchase History
| Date | Buyer | Sale Price | Title Company |
|---|---|---|---|
| Matute Jose A | $101,500 | American Coast Title |
Source: Public Records
Mortgage History
| Date | Status | Borrower | Loan Amount |
|---|---|---|---|
| Open | Matute Jose A | $80,800 | |
| Closed | Matute Jose A | $20,250 |
Source: Public Records
Tax History Compared to Growth
Tax History
| Year | Tax Paid | Tax Assessment Tax Assessment Total Assessment is a certain percentage of the fair market value that is determined by local assessors to be the total taxable value of land and additions on the property. | Land | Improvement |
|---|---|---|---|---|
| 2025 | $1,936 | $152,165 | $121,738 | $30,427 |
| 2024 | $1,936 | $149,182 | $119,351 | $29,831 |
| 2023 | $1,905 | $146,258 | $117,011 | $29,247 |
| 2022 | $1,824 | $143,391 | $114,717 | $28,674 |
| 2021 | $1,793 | $140,580 | $112,468 | $28,112 |
| 2019 | $1,741 | $136,412 | $109,133 | $27,279 |
| 2018 | $1,685 | $133,739 | $106,994 | $26,745 |
| 2016 | $1,603 | $128,548 | $102,841 | $25,707 |
| 2015 | $1,580 | $126,618 | $101,297 | $25,321 |
| 2014 | $1,594 | $124,138 | $99,313 | $24,825 |
Source: Public Records
Map
Nearby Homes