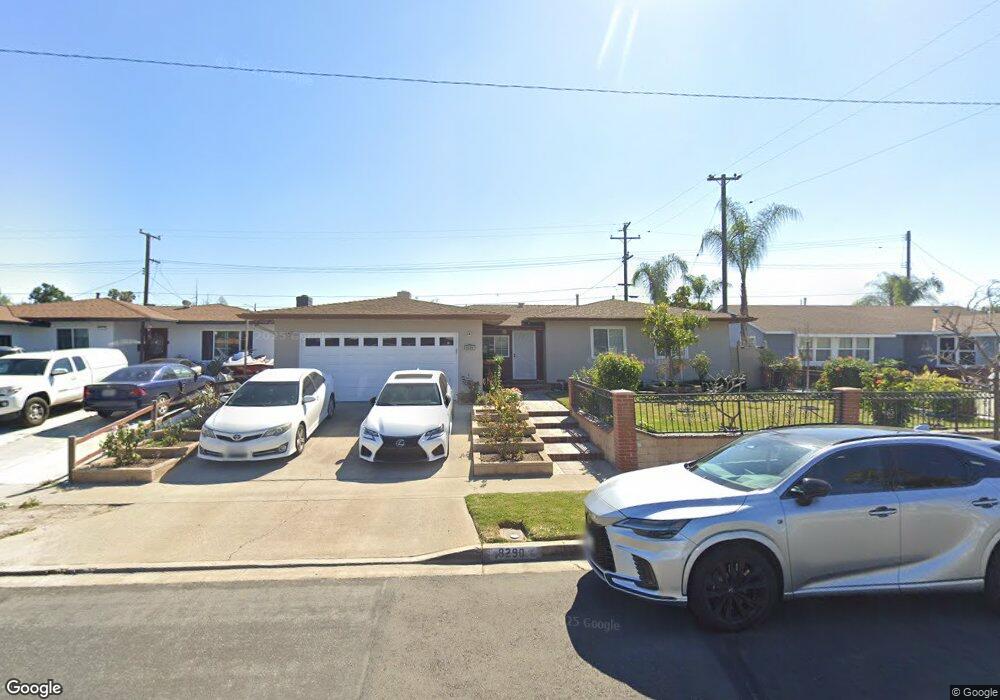
8290 Dracaena Dr Buena Park, CA 90620
Estimated Value: $769,000 - $884,000
3
Beds
2
Baths
1,175
Sq Ft
$713/Sq Ft
Est. Value
About This Home
This home is located at 8290 Dracaena Dr, Buena Park, CA 90620 and is currently estimated at $838,077, approximately $713 per square foot. 8290 Dracaena Dr is a home located in Orange County with nearby schools including Glen H. Dysinger Sr. Elementary School, Dale Jr High School, and Savanna High School.
Ownership History
Date
Name
Owned For
Owner Type
Purchase Details
Closed on
Nov 23, 2022
Sold by
Chandra Abhilash
Bought by
Abhilash Chandra Living Trust
Current Estimated Value
Purchase Details
Closed on
Jun 8, 2021
Sold by
Chandra Abhilash and Chandra Abhilas
Bought by
Chandra Abhilash
Home Financials for this Owner
Home Financials are based on the most recent Mortgage that was taken out on this home.
Original Mortgage
$440,000
Interest Rate
2.9%
Mortgage Type
New Conventional
Purchase Details
Closed on
Aug 26, 2013
Sold by
Chandra Anshu and Chandra Abhilas
Bought by
Chandra Abhilas
Purchase Details
Closed on
Jul 18, 2002
Sold by
Ruhl John C and Ruhl Jean Ann
Bought by
Chandra Abhilas and Chandra Anshu
Home Financials for this Owner
Home Financials are based on the most recent Mortgage that was taken out on this home.
Original Mortgage
$263,859
Interest Rate
6.52%
Mortgage Type
FHA
Create a Home Valuation Report for This Property
The Home Valuation Report is an in-depth analysis detailing your home's value as well as a comparison with similar homes in the area
Home Values in the Area
Average Home Value in this Area
Purchase History
| Date | Buyer | Sale Price | Title Company |
|---|---|---|---|
| Abhilash Chandra Living Trust | -- | -- | |
| Chandra Abhilash | -- | Fin Title | |
| Chandra Abhilas | -- | Stewart Title Company | |
| Chandra Abhilas | $268,000 | Chicago Title Co |
Source: Public Records
Mortgage History
| Date | Status | Borrower | Loan Amount |
|---|---|---|---|
| Previous Owner | Chandra Abhilash | $440,000 | |
| Previous Owner | Chandra Abhilas | $263,859 | |
| Closed | Chandra Abhilas | $8,040 |
Source: Public Records
Tax History Compared to Growth
Tax History
| Year | Tax Paid | Tax Assessment Tax Assessment Total Assessment is a certain percentage of the fair market value that is determined by local assessors to be the total taxable value of land and additions on the property. | Land | Improvement |
|---|---|---|---|---|
| 2025 | $4,604 | $388,145 | $306,924 | $81,221 |
| 2024 | $4,604 | $380,535 | $300,906 | $79,629 |
| 2023 | $4,490 | $373,074 | $295,006 | $78,068 |
| 2022 | $4,433 | $365,759 | $289,221 | $76,538 |
| 2021 | $4,370 | $358,588 | $283,550 | $75,038 |
| 2020 | $4,345 | $354,912 | $280,643 | $74,269 |
| 2019 | $4,238 | $347,953 | $275,140 | $72,813 |
| 2018 | $4,163 | $341,131 | $269,745 | $71,386 |
| 2017 | $4,033 | $334,443 | $264,456 | $69,987 |
| 2016 | $3,958 | $327,886 | $259,271 | $68,615 |
| 2015 | $3,914 | $322,961 | $255,376 | $67,585 |
| 2014 | $3,719 | $316,635 | $250,373 | $66,262 |
Source: Public Records
Map
Nearby Homes
- 2955 W Lincoln Ave Unit 7
- 2871 W Tyler Ave
- 2943 W Lincoln Ave
- 400 N Syracuse St
- Plan Two at Mason
- Plan Four at Mason
- Plan Three at Mason
- Plan Seven at Mason
- 2770 W Lincoln Ave Unit 40
- 2770 W Lincoln Ave Unit 58
- 8452 Stanton Ave
- 109 S Laxore St
- 103 S Laxore St
- 106 S Laxore St Unit 407
- 107 S Laxore St
- 8319 Hickory Dr
- 3053 W Coolidge Ave
- 7950 Jackson Way
- 605 N La Reina St
- 2709 W Madison Cir
- 8302 Dracaena Dr
- 8292 Dracaena Dr
- 2864 W Coolidge Ave
- 2860 W Coolidge Ave
- 8314 Dracaena Dr
- 2870 W Coolidge Ave
- 8272 Dracaena Dr
- 2854 W Coolidge Ave
- 8291 Dracaena Dr
- 8326 Dracaena Dr
- 322 N Bel Air St
- 8702 Bel Air St
- 8703 Cedar Dr
- 8720 Cedar Dr
- 8338 Dracaena Dr
- 2850 W Coolidge Ave
- 2865 W Coolidge Ave
- 2861 W Coolidge Ave
- 8682 Bel Air St
- 2871 W Coolidge Ave