
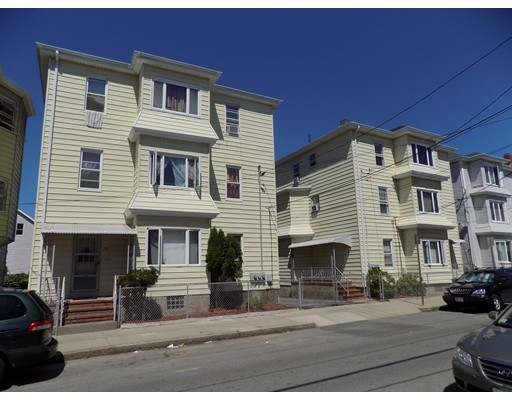
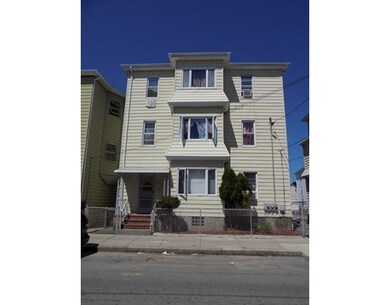
83 Flint St Fall River, MA 02723
Flint Neighborhood
13
Beds
6
Baths
5,050
Sq Ft
4,792
Sq Ft Lot
About This Home
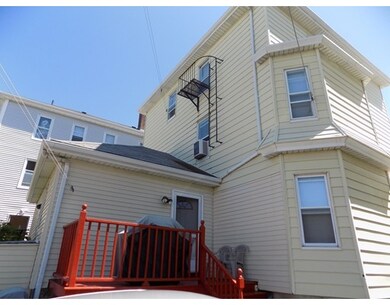
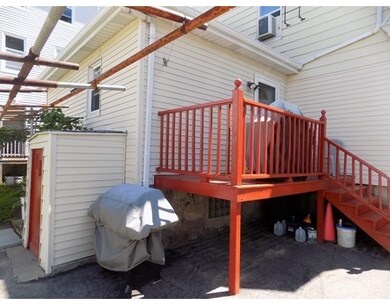
As of February 2022* * PRICE REDUCED/ MOTIVATED SELLERS * * * Well Maintained & Updated Two (3)-Family units with shared driveway. All Apartments completely remodeled/ updated. All separate utilities. Newer windows and maintenance free exterior. 5 units are 2 bedrooms (space heaters). 1 unit (first floor) is a 3 bedroom unit with baseboard gas heat. Separate washer/ dryer hookups in basement in each building along with individual storage units. Nice completely fenced in yard with plenty of off street parking. Walking to close by shopping and bus routes. Great investment or owner occupy. Great rental income. Current rents are below market. All tenants at will. Call or text to schedule a showing.
Last Buyer's Agent
Carolyn Burton
Carolyn A. Burton & Associates License #450500044
Property Details
Home Type
Multi-Family
Est. Annual Taxes
$5,134
Year Built
1900
Lot Details
0
Listing Details
- Lot Description: Paved Drive
- Property Type: Multi-family
- Other Agent: 1.00
- Lead Paint: Unknown
- Insc: 2800
- Special Features: None
- Property Sub Type: MultiFamily
- Year Built: 1900
Interior Features
- Has Basement: Yes
- Number of Rooms: 16
- Amenities: Public Transportation, Shopping, Park, Medical Facility, Highway Access
- Electric: Individually Metered
- Flooring: Wall to Wall Carpet, Laminate, Hardwood
- Basement: Full
- Total Levels: 9
Exterior Features
- Exterior: Vinyl
- Foundation: Granite
Garage/Parking
- Parking: Off-Street, Paved Driveway
- Parking Spaces: 5
Utilities
- Hot Water: Natural Gas
- Sewer: City/Town Sewer
- Water: City/Town Water
- Sewer: 1800
Condo/Co-op/Association
- Total Units: 6
Lot Info
- Zoning: UNK
Multi Family
- APOD Available: Yes
- Expenses Year End: 12/15
- Foundation: IRR
- Total Bedrooms: 13
- Total Floors: 9
- Total Full Baths: 6
- Total Levels: 3
- Total Rms: 21
- Total Rent_1: 4250
Ownership History
Date
Name
Owned For
Owner Type
Purchase Details
Closed on
Feb 23, 2007
Sold by
Oliveira Alfred
Bought by
Oliveira Alfred and Mendoza Maryanne
Current Estimated Value
Similar Home in Fall River, MA
Create a Home Valuation Report for This Property
The Home Valuation Report is an in-depth analysis detailing your home's value as well as a comparison with similar homes in the area
Home Values in the Area
Average Home Value in this Area
Purchase History
| Date | Type | Sale Price | Title Company |
|---|---|---|---|
| Deed | -- | -- |
Source: Public Records
Mortgage History
| Date | Status | Loan Amount | Loan Type |
|---|---|---|---|
| Open | $425,315 | FHA | |
| Closed | $14,043 | FHA | |
| Closed | $254,799 | FHA | |
| Closed | $340,000 | New Conventional | |
| Closed | $211,500 | Commercial |
Source: Public Records
Property History
| Date | Event | Price | Change | Sq Ft Price |
|---|---|---|---|---|
| 02/25/2022 02/25/22 | Sold | $440,000 | -2.2% | $175 / Sq Ft |
| 01/20/2022 01/20/22 | Pending | -- | -- | -- |
| 01/14/2022 01/14/22 | For Sale | -- | -- | -- |
| 11/10/2021 11/10/21 | Pending | -- | -- | -- |
| 10/28/2021 10/28/21 | For Sale | $449,900 | +73.7% | $179 / Sq Ft |
| 05/31/2019 05/31/19 | Sold | $259,000 | -0.2% | $54 / Sq Ft |
| 04/05/2019 04/05/19 | Pending | -- | -- | -- |
| 02/22/2019 02/22/19 | Price Changed | $259,499 | -0.2% | $54 / Sq Ft |
| 02/12/2019 02/12/19 | For Sale | $259,999 | -23.5% | $54 / Sq Ft |
| 02/01/2019 02/01/19 | Sold | $340,000 | -2.6% | $81 / Sq Ft |
| 01/14/2019 01/14/19 | Pending | -- | -- | -- |
| 01/09/2019 01/09/19 | For Sale | $349,000 | +23.8% | $83 / Sq Ft |
| 08/19/2016 08/19/16 | Sold | $282,000 | -2.1% | $56 / Sq Ft |
| 06/22/2016 06/22/16 | Pending | -- | -- | -- |
| 04/08/2016 04/08/16 | Price Changed | $288,000 | -0.7% | $57 / Sq Ft |
| 03/03/2016 03/03/16 | Price Changed | $290,000 | -1.7% | $57 / Sq Ft |
| 11/30/2015 11/30/15 | Price Changed | $295,000 | -1.3% | $58 / Sq Ft |
| 11/03/2015 11/03/15 | Price Changed | $299,000 | -9.1% | $59 / Sq Ft |
| 08/13/2015 08/13/15 | For Sale | $329,000 | -- | $65 / Sq Ft |
Source: MLS Property Information Network (MLS PIN)
Tax History Compared to Growth
Tax History
| Year | Tax Paid | Tax Assessment Tax Assessment Total Assessment is a certain percentage of the fair market value that is determined by local assessors to be the total taxable value of land and additions on the property. | Land | Improvement |
|---|---|---|---|---|
| 2025 | $5,134 | $448,400 | $100,200 | $348,200 |
| 2024 | $4,879 | $424,600 | $93,500 | $331,100 |
| 2023 | $4,102 | $334,300 | $78,500 | $255,800 |
| 2022 | $3,665 | $290,400 | $74,700 | $215,700 |
| 2021 | $3,386 | $244,800 | $71,500 | $173,300 |
| 2020 | $5,111 | $353,700 | $70,500 | $283,200 |
| 2019 | $3,947 | $270,700 | $70,500 | $200,200 |
| 2018 | $3,724 | $254,700 | $74,700 | $180,000 |
| 2017 | $3,566 | $254,700 | $74,700 | $180,000 |
| 2016 | $3,639 | $267,000 | $91,400 | $175,600 |
| 2015 | $3,401 | $260,000 | $87,900 | $172,100 |
| 2014 | $3,595 | $285,800 | $97,600 | $188,200 |
Source: Public Records
Agents Affiliated with this Home
-
Fabio Bicho
Seller's Agent in 2022
Fabio Bicho
RE/MAX Vantage
(774) 305-5820
4 in this area
108 Total Sales
-
Zeke Gomez
Z
Seller Co-Listing Agent in 2022
Zeke Gomez
LPT Realty - Home & Key Group
(774) 488-8092
1 in this area
13 Total Sales
-
Kevin Teves
Seller's Agent in 2019
Kevin Teves
SBA Realty Group
(508) 596-3615
12 in this area
72 Total Sales
-
J
Seller's Agent in 2019
Jacques Handal
Coldwell Banker Realty - Weston
-
Alfredo Medeiros
Seller's Agent in 2016
Alfredo Medeiros
Rosewood Realty
(508) 642-0107
1 in this area
8 Total Sales
-
C
Buyer's Agent in 2016
Carolyn Burton
Carolyn A. Burton & Associates
Map
Source: MLS Property Information Network (MLS PIN)
MLS Number: 71888835
APN: FALL-000013K-000000-000017
Disclaimer: Certain information contained herein is derived from information provided by parties other than Homes.com. All information provided is deemed reliable, but is not guaranteed to be accurate and should be independently verified.
![]() The property listing data and information, or the Images, set forth herein were provided to MLS Property Information Network, Inc. from third party sources, including sellers, lessors and public records, and were compiled by MLS Property Information Network, Inc. The property listing data and information, and the Images, are for the personal, non-commercial use of consumers having a good faith interest in purchasing or leasing listed properties of the type displayed to them and may not be used for any purpose other than to identify prospective properties which such consumers may have a good faith interest in purchasing or leasing. MLS Property Information Network, Inc. and its subscribers disclaim any and all representations and warranties as to the accuracy of the property listing data and information, or as to the accuracy of any of the Images, set forth herein.
The property listing data and information, or the Images, set forth herein were provided to MLS Property Information Network, Inc. from third party sources, including sellers, lessors and public records, and were compiled by MLS Property Information Network, Inc. The property listing data and information, and the Images, are for the personal, non-commercial use of consumers having a good faith interest in purchasing or leasing listed properties of the type displayed to them and may not be used for any purpose other than to identify prospective properties which such consumers may have a good faith interest in purchasing or leasing. MLS Property Information Network, Inc. and its subscribers disclaim any and all representations and warranties as to the accuracy of the property listing data and information, or as to the accuracy of any of the Images, set forth herein.
Nearby Homes
- 1244 Pleasant St
- 17 Canonicus St
- 90 Hargraves St
- 178 Thomas St
- 274 Harrison St
- 78 Thomas St
- 52 Rocliffe St
- 48 Rocliffe St
- 173 County St
- 321 Harrison St
- 338 Jencks St
- 25 Lebanon St Unit D
- 25 Lebanon St Unit C
- 25 Lebanon St Unit B
- 25 Lebanon St Unit A
- 422 County St
- 139 Covel St
- 84 Everett St
- 44 Haffards St
- 310 Alden St