K
Seller's Agent in 2019
Karen Coraccio
Boardwalk Real Estate
1 in this area
9 Total Sales


Estimated Value: $1,009,000 - $1,240,000
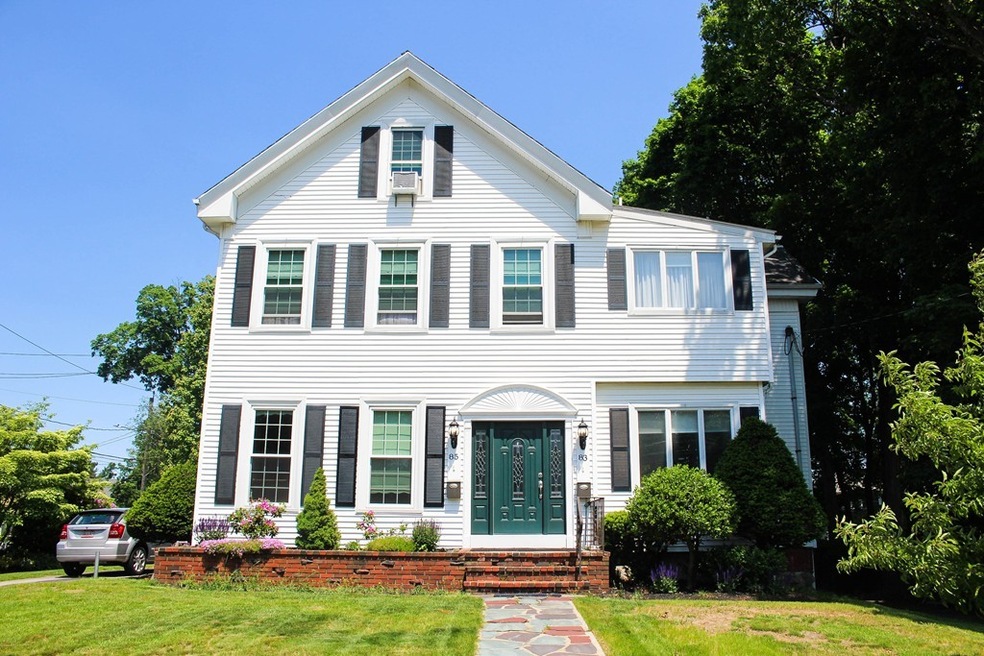
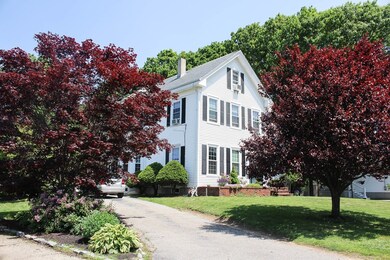
Great Multi-family on a corner lot in a desirable neighborhood in Reading, close to the Reading library and beautiful downtown. The property is a Short walk to the train and public transportation, easy access to Rt's 93 and 95. Beautiful features throughout including high beamed ceilings, stunning staircase, built-ins, window seats, hardwood floors, wide casings, and a new 2nd floor Kitchen with Granite countertops. Exterior is virtually maintenance free with Vinyl Siding, energy-efficient tilt in vinyl windows, stunning Fiberglass front door with decorative glass. Ample parking.
| Date | Buyer | Sale Price | Title Company |
|---|---|---|---|
| Sosa Alberto | $440,000 | -- | |
| Harrington Gayle R | -- | -- |
| Date | Status | Borrower | Loan Amount |
|---|---|---|---|
| Open | Sosa Alberto | $352,000 |
| Date | Event | Price | List to Sale | Price per Sq Ft |
|---|---|---|---|---|
| 07/26/2019 07/26/19 | Sold | $745,000 | -6.9% | $222 / Sq Ft |
| 06/13/2019 06/13/19 | Pending | -- | -- | -- |
| 06/05/2019 06/05/19 | For Sale | $799,900 | -- | $238 / Sq Ft |
| Year | Tax Paid | Tax Assessment Tax Assessment Total Assessment is a certain percentage of the fair market value that is determined by local assessors to be the total taxable value of land and additions on the property. | Land | Improvement |
|---|---|---|---|---|
| 2025 | $10,249 | $899,800 | $458,400 | $441,400 |
| 2024 | $10,366 | $884,500 | $450,600 | $433,900 |
| 2023 | $10,493 | $833,400 | $424,600 | $408,800 |
| 2022 | $10,164 | $762,500 | $388,500 | $374,000 |
| 2021 | $9,530 | $690,100 | $335,000 | $355,100 |
| 2020 | $9,274 | $664,800 | $324,200 | $340,600 |
| 2019 | $8,868 | $623,200 | $303,900 | $319,300 |
| 2018 | $8,229 | $593,300 | $289,300 | $304,000 |
| 2017 | $7,841 | $558,900 | $270,200 | $288,700 |
| 2016 | $7,336 | $505,900 | $269,000 | $236,900 |
| 2015 | $7,149 | $486,300 | $248,600 | $237,700 |
| 2014 | $6,991 | $474,300 | $240,100 | $234,200 |
K
Seller's Agent in 2019
Karen Coraccio
Boardwalk Real Estate
1 in this area
9 Total Sales

Buyer's Agent in 2019
Katya Pitts
(617) 335-8552
25 Total Sales
Source: MLS Property Information Network (MLS PIN)
MLS Number: 72513340
APN: READ-000021-000000-000287
Disclaimer: Certain information contained herein is derived from information provided by parties other than Homes.com. All information provided is deemed reliable, but is not guaranteed to be accurate and should be independently verified.
![]() The property listing data and information, or the Images, set forth herein were provided to MLS Property Information Network, Inc. from third party sources, including sellers, lessors and public records, and were compiled by MLS Property Information Network, Inc. The property listing data and information, and the Images, are for the personal, non-commercial use of consumers having a good faith interest in purchasing or leasing listed properties of the type displayed to them and may not be used for any purpose other than to identify prospective properties which such consumers may have a good faith interest in purchasing or leasing. MLS Property Information Network, Inc. and its subscribers disclaim any and all representations and warranties as to the accuracy of the property listing data and information, or as to the accuracy of any of the Images, set forth herein.
The property listing data and information, or the Images, set forth herein were provided to MLS Property Information Network, Inc. from third party sources, including sellers, lessors and public records, and were compiled by MLS Property Information Network, Inc. The property listing data and information, and the Images, are for the personal, non-commercial use of consumers having a good faith interest in purchasing or leasing listed properties of the type displayed to them and may not be used for any purpose other than to identify prospective properties which such consumers may have a good faith interest in purchasing or leasing. MLS Property Information Network, Inc. and its subscribers disclaim any and all representations and warranties as to the accuracy of the property listing data and information, or as to the accuracy of any of the Images, set forth herein.
Ask me questions while you tour the home.