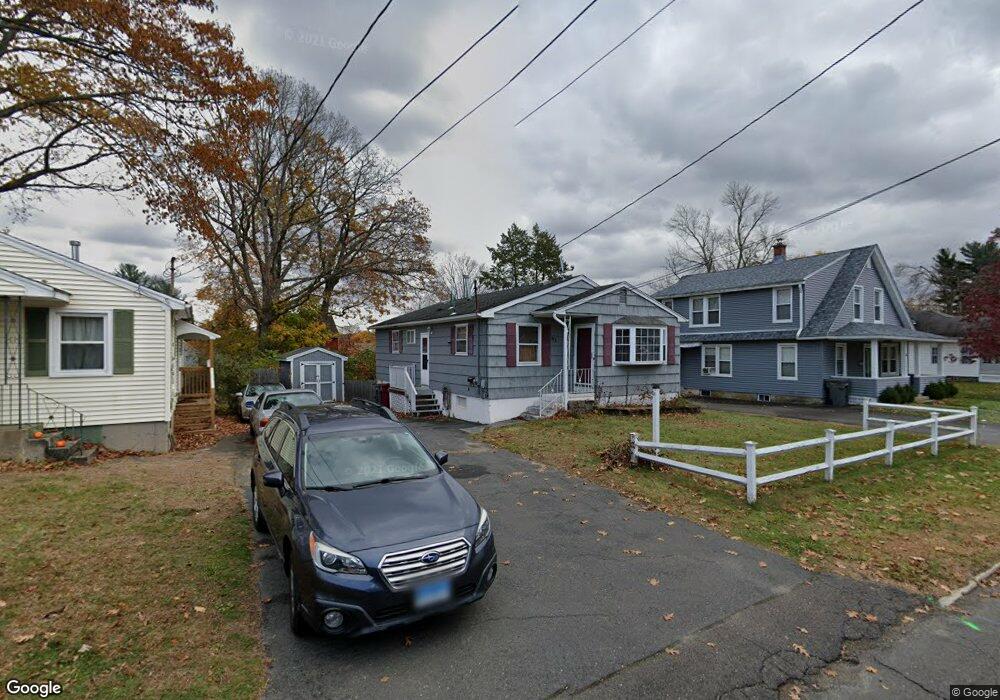
83 N Hoadley St Naugatuck, CT 06770
Estimated Value: $309,716 - $318,000
3
Beds
1
Bath
977
Sq Ft
$321/Sq Ft
Est. Value
About This Home
This home is located at 83 N Hoadley St, Naugatuck, CT 06770 and is currently estimated at $313,679, approximately $321 per square foot. 83 N Hoadley St is a home located in New Haven County with nearby schools including City Hill Middle School, Naugatuck High School, and Our Lady Of Mount Carmel School.
Ownership History
Date
Name
Owned For
Owner Type
Purchase Details
Closed on
Jan 26, 2011
Sold by
Wood Robert P
Bought by
Pistarelli Jennifer A
Current Estimated Value
Home Financials for this Owner
Home Financials are based on the most recent Mortgage that was taken out on this home.
Original Mortgage
$122,715
Outstanding Balance
$84,170
Interest Rate
4.83%
Mortgage Type
Purchase Money Mortgage
Estimated Equity
$229,509
Purchase Details
Closed on
Jul 1, 1991
Sold by
Pun Wan and Pun Bik
Bought by
Demers Raymond and Porter Lois
Create a Home Valuation Report for This Property
The Home Valuation Report is an in-depth analysis detailing your home's value as well as a comparison with similar homes in the area
Home Values in the Area
Average Home Value in this Area
Purchase History
| Date | Buyer | Sale Price | Title Company |
|---|---|---|---|
| Pistarelli Jennifer A | $135,000 | -- | |
| Demers Raymond | $108,000 | -- |
Source: Public Records
Mortgage History
| Date | Status | Borrower | Loan Amount |
|---|---|---|---|
| Open | Demers Raymond | $122,715 | |
| Previous Owner | Demers Raymond | $139,987 | |
| Previous Owner | Demers Raymond | $70,000 |
Source: Public Records
Tax History Compared to Growth
Tax History
| Year | Tax Paid | Tax Assessment Tax Assessment Total Assessment is a certain percentage of the fair market value that is determined by local assessors to be the total taxable value of land and additions on the property. | Land | Improvement |
|---|---|---|---|---|
| 2025 | $5,690 | $143,010 | $28,000 | $115,010 |
| 2024 | $5,976 | $143,010 | $28,000 | $115,010 |
| 2023 | $6,400 | $143,010 | $28,000 | $115,010 |
| 2022 | $4,567 | $95,640 | $29,770 | $65,870 |
| 2021 | $4,567 | $95,640 | $29,770 | $65,870 |
| 2020 | $4,567 | $95,640 | $29,770 | $65,870 |
| 2019 | $4,519 | $95,640 | $29,770 | $65,870 |
| 2018 | $4,432 | $91,660 | $38,070 | $53,590 |
| 2017 | $4,450 | $91,660 | $38,070 | $53,590 |
| 2016 | $4,369 | $91,660 | $38,070 | $53,590 |
| 2015 | $4,177 | $91,660 | $38,070 | $53,590 |
| 2014 | $4,130 | $91,660 | $38,070 | $53,590 |
| 2012 | $4,308 | $128,410 | $45,420 | $82,990 |
Source: Public Records
Map
Nearby Homes
- 66 N Hoadley St
- 19 Casper Ct
- 92 Birch Ln
- 15 Summit Rd
- 155 Hoadley St
- 37 Seth Dr
- 49 Damson Ln
- 43 Marshall Ave
- 25 Walnut Terrace
- 56 Hoadley St
- 28 Highland Ave
- 24 New St
- 23 Salem St
- 37 Goodyear Ave
- 28 Nettleton Ave
- 627 Millville Ave Unit 9-8
- 18 Bridge St Unit 1O
- 18 Bridge St Unit 4B
- 20 George St
- 470 Rubber Ave