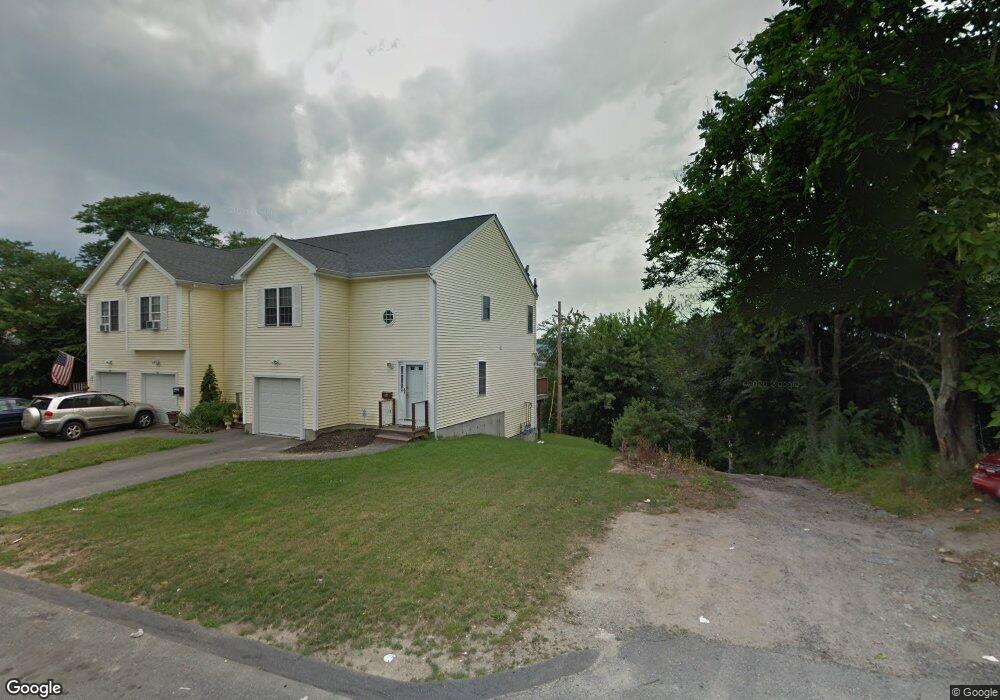
83 Orient St Unit 83 Worcester, MA 01604
Franklin Plantation NeighborhoodEstimated Value: $397,607 - $450,000
3
Beds
2
Baths
1,615
Sq Ft
$264/Sq Ft
Est. Value
About This Home
This home is located at 83 Orient St Unit 83, Worcester, MA 01604 and is currently estimated at $426,402, approximately $264 per square foot. 83 Orient St Unit 83 is a home located in Worcester County with nearby schools including Jacob Hiatt Magnet School, Chandler Magnet, and Grafton Street.
Ownership History
Date
Name
Owned For
Owner Type
Purchase Details
Closed on
Dec 19, 2016
Sold by
Ayonne-Abibi Doudou C
Bought by
Ewur Nana K and Odoom Jennifer
Current Estimated Value
Home Financials for this Owner
Home Financials are based on the most recent Mortgage that was taken out on this home.
Original Mortgage
$214,051
Outstanding Balance
$177,370
Interest Rate
4.4%
Mortgage Type
FHA
Estimated Equity
$249,032
Purchase Details
Closed on
Apr 15, 2010
Sold by
Ayome-Abibi Claude D and Ayome-Abibi Doudou Claude
Bought by
Ayome-Abibi Doudou Claude
Purchase Details
Closed on
May 26, 2005
Sold by
85 Orient St T and Lippman Douglas
Bought by
Ayome-Abibi Claude D and Abibi Hawa
Home Financials for this Owner
Home Financials are based on the most recent Mortgage that was taken out on this home.
Original Mortgage
$188,000
Interest Rate
5.94%
Mortgage Type
Purchase Money Mortgage
Create a Home Valuation Report for This Property
The Home Valuation Report is an in-depth analysis detailing your home's value as well as a comparison with similar homes in the area
Home Values in the Area
Average Home Value in this Area
Purchase History
| Date | Buyer | Sale Price | Title Company |
|---|---|---|---|
| Ewur Nana K | $218,000 | -- | |
| Ayome-Abibi Doudou Claude | -- | -- | |
| Ayome-Abibi Claude D | $235,000 | -- |
Source: Public Records
Mortgage History
| Date | Status | Borrower | Loan Amount |
|---|---|---|---|
| Open | Ewur Nana K | $214,051 | |
| Previous Owner | Ayome-Abibi Claude D | $188,000 |
Source: Public Records
Tax History
| Year | Tax Paid | Tax Assessment Tax Assessment Total Assessment is a certain percentage of the fair market value that is determined by local assessors to be the total taxable value of land and additions on the property. | Land | Improvement |
|---|---|---|---|---|
| 2025 | $4,706 | $356,800 | $82,500 | $274,300 |
| 2024 | $4,451 | $323,700 | $82,500 | $241,200 |
| 2023 | $4,266 | $297,500 | $71,700 | $225,800 |
| 2022 | $3,912 | $257,200 | $57,400 | $199,800 |
| 2021 | $3,780 | $232,200 | $45,900 | $186,300 |
| 2020 | $3,706 | $218,000 | $45,600 | $172,400 |
| 2019 | $3,544 | $196,900 | $39,800 | $157,100 |
| 2018 | $3,536 | $187,000 | $39,800 | $147,200 |
| 2017 | $3,337 | $173,600 | $39,800 | $133,800 |
| 2016 | $3,291 | $159,700 | $28,800 | $130,900 |
| 2015 | $3,205 | $159,700 | $28,800 | $130,900 |
| 2014 | $3,121 | $159,700 | $28,800 | $130,900 |
Source: Public Records
Map
Nearby Homes
- 115 Orient St
- 24 Ingleside Ave
- 13 Groton Place
- 5 Mcfarland Ct
- 34 Robin Rd
- 247 Shrewsbury St
- 1 Verdi Rd
- 68 Dartmouth St
- 78 Gage St
- 103 Hamilton St
- 29 Chilmark St
- 15 Houghton St Unit 9
- 155 Hamilton St Unit 4
- 9 Barclay St
- 80 Mulberry St
- 80 Delmont Ave
- 112 Harrison St
- 21 Mott St
- 47 Laurel St
- 32 Providence St Unit 5
Your Personal Tour Guide
Ask me questions while you tour the home.