Estimated Value: $139,000 - $193,000
--
Bed
--
Bath
2,927
Sq Ft
$55/Sq Ft
Est. Value
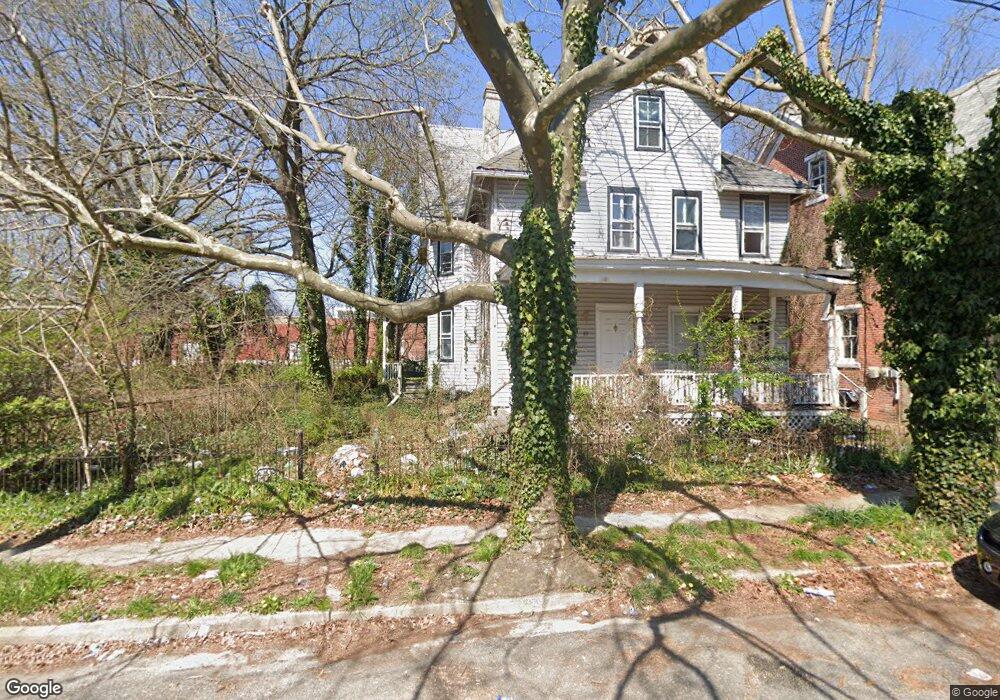
About This Home
This home is located at 83 Seventh St Unit 85, Salem, NJ 08079 and is currently estimated at $159,898, approximately $54 per square foot. 83 Seventh St Unit 85 is a home located in Salem County with nearby schools including John Fenwick Elementary School, Salem Middle School, and Salem High School.
Ownership History
Date
Name
Owned For
Owner Type
Purchase Details
Closed on
Apr 1, 2012
Sold by
Walnut Investments Inc
Bought by
Weingarten Aron
Current Estimated Value
Purchase Details
Closed on
Nov 29, 2011
Sold by
Heinemann Joseph
Bought by
Walnut Investments Inc
Purchase Details
Closed on
Sep 30, 2011
Sold by
Washington Charles
Bought by
Heinemann Joseph
Purchase Details
Closed on
Jan 31, 2006
Sold by
Pryce Clifton R
Bought by
Washington Charles
Home Financials for this Owner
Home Financials are based on the most recent Mortgage that was taken out on this home.
Original Mortgage
$63,000
Interest Rate
10.55%
Mortgage Type
Fannie Mae Freddie Mac
Purchase Details
Closed on
Sep 9, 1994
Sold by
Dewald Betty L
Bought by
Pryce Clifton
Create a Home Valuation Report for This Property
The Home Valuation Report is an in-depth analysis detailing your home's value as well as a comparison with similar homes in the area
Home Values in the Area
Average Home Value in this Area
Purchase History
| Date | Buyer | Sale Price | Title Company |
|---|---|---|---|
| Weingarten Aron | $45,000 | Successful Abstract Llc | |
| Walnut Investments Inc | $40,000 | -- | |
| Heinemann Joseph | $40,000 | -- | |
| Washington Charles | $70,000 | Salem Oak Title Agency Inc | |
| Pryce Clifton | $55,000 | Intercoastal Title Agency In |
Source: Public Records
Mortgage History
| Date | Status | Borrower | Loan Amount |
|---|---|---|---|
| Previous Owner | Washington Charles | $63,000 |
Source: Public Records
Tax History Compared to Growth
Tax History
| Year | Tax Paid | Tax Assessment Tax Assessment Total Assessment is a certain percentage of the fair market value that is determined by local assessors to be the total taxable value of land and additions on the property. | Land | Improvement |
|---|---|---|---|---|
| 2025 | $4,810 | $58,500 | $8,400 | $50,100 |
| 2024 | $4,599 | $58,500 | $8,400 | $50,100 |
| 2023 | $4,599 | $58,500 | $8,400 | $50,100 |
| 2022 | $4,397 | $58,500 | $8,400 | $50,100 |
| 2021 | $4,246 | $58,500 | $8,400 | $50,100 |
| 2020 | $4,161 | $58,500 | $8,400 | $50,100 |
| 2019 | $4,135 | $58,500 | $8,400 | $50,100 |
| 2018 | $4,045 | $58,500 | $8,400 | $50,100 |
| 2017 | $3,996 | $58,500 | $8,400 | $50,100 |
| 2016 | $4,272 | $109,100 | $14,500 | $94,600 |
| 2015 | $4,218 | $109,100 | $14,500 | $94,600 |
| 2014 | $4,196 | $109,100 | $14,500 | $94,600 |
Source: Public Records
Map
Nearby Homes