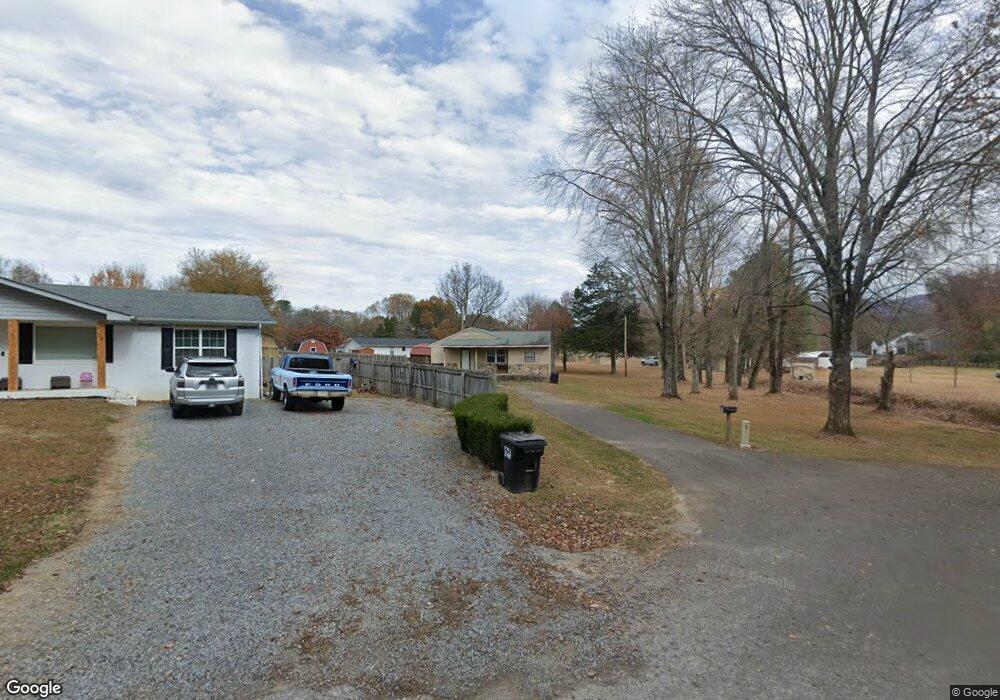
83 Wilson St Dunlap, TN 37327
Estimated Value: $191,000 - $234,000
3
Beds
1
Bath
1,275
Sq Ft
$166/Sq Ft
Est. Value
About This Home
This home is located at 83 Wilson St, Dunlap, TN 37327 and is currently estimated at $211,926, approximately $166 per square foot. 83 Wilson St is a home located in Sequatchie County with nearby schools including Griffith Elementary School, Sequatchie County Middle School, and Sequatchie County High School.
Ownership History
Date
Name
Owned For
Owner Type
Purchase Details
Closed on
Sep 14, 2015
Sold by
Wells Phillip Lamar
Bought by
Rogers Dennis Lars
Current Estimated Value
Home Financials for this Owner
Home Financials are based on the most recent Mortgage that was taken out on this home.
Original Mortgage
$69,897
Outstanding Balance
$54,710
Interest Rate
3.97%
Mortgage Type
New Conventional
Estimated Equity
$157,216
Purchase Details
Closed on
Nov 17, 2005
Sold by
Tina Johnson
Bought by
Lamar Wells Phillip
Home Financials for this Owner
Home Financials are based on the most recent Mortgage that was taken out on this home.
Original Mortgage
$70,100
Interest Rate
6%
Purchase Details
Closed on
Apr 13, 1998
Sold by
Johnson Gregory K and Johnson Wife
Bought by
Tina Johnson
Home Financials for this Owner
Home Financials are based on the most recent Mortgage that was taken out on this home.
Original Mortgage
$47,200
Interest Rate
7.09%
Purchase Details
Closed on
Oct 30, 1989
Bought by
Johnson Gregory K and Wife Michele S
Create a Home Valuation Report for This Property
The Home Valuation Report is an in-depth analysis detailing your home's value as well as a comparison with similar homes in the area
Home Values in the Area
Average Home Value in this Area
Purchase History
| Date | Buyer | Sale Price | Title Company |
|---|---|---|---|
| Rogers Dennis Lars | $68,500 | -- | |
| Lamar Wells Phillip | $89,000 | -- | |
| Tina Johnson | $59,000 | -- | |
| Johnson Gregory K | $37,700 | -- |
Source: Public Records
Mortgage History
| Date | Status | Borrower | Loan Amount |
|---|---|---|---|
| Open | Rogers Dennis Lars | $69,897 | |
| Previous Owner | Johnson Gregory K | $70,100 | |
| Previous Owner | Johnson Gregory K | $47,200 |
Source: Public Records
Tax History
| Year | Tax Paid | Tax Assessment Tax Assessment Total Assessment is a certain percentage of the fair market value that is determined by local assessors to be the total taxable value of land and additions on the property. | Land | Improvement |
|---|---|---|---|---|
| 2025 | $794 | $32,875 | $3,575 | $29,300 |
| 2024 | $794 | $32,875 | $3,575 | $29,300 |
| 2023 | $794 | $32,875 | $3,575 | $29,300 |
| 2022 | $568 | $17,125 | $2,600 | $14,525 |
| 2021 | $559 | $17,125 | $2,600 | $14,525 |
| 2020 | $559 | $17,125 | $2,600 | $14,525 |
| 2019 | $559 | $17,125 | $2,600 | $14,525 |
| 2018 | $516 | $15,950 | $2,600 | $13,350 |
| 2017 | $510 | $15,950 | $2,600 | $13,350 |
| 2016 | $564 | $16,950 | $2,600 | $14,350 |
| 2015 | $565 | $16,950 | $2,600 | $14,350 |
| 2014 | $567 | $17,025 | $2,600 | $14,425 |
Source: Public Records
Map
Nearby Homes
- 267 Williams Rd
- 217 A Day Dream Dr
- 134 River Ridge Dr Unit 117
- 134 River Ridge Dr
- 481 Tram Trail
- 79 Bear Oak Dr
- 453 Hill Cir
- 239 Bear Oak Dr
- 249 Bear Oak Dr
- 157 Bear Oak Dr
- Lot 36 River Ridge Dr
- 1086 River Ridge Dr
- 1086 River Ridge Dr Unit Lot 58
- 3 Fredonia Rd
- 1038 Sawmill Creek Rd
- 1 Fredonia Rd
- 0 Fredonia Loop
- 402 Old State Highway 8
- 2 Fredonia Rd
- 11342 Fredonia Rd
Your Personal Tour Guide
Ask me questions while you tour the home.