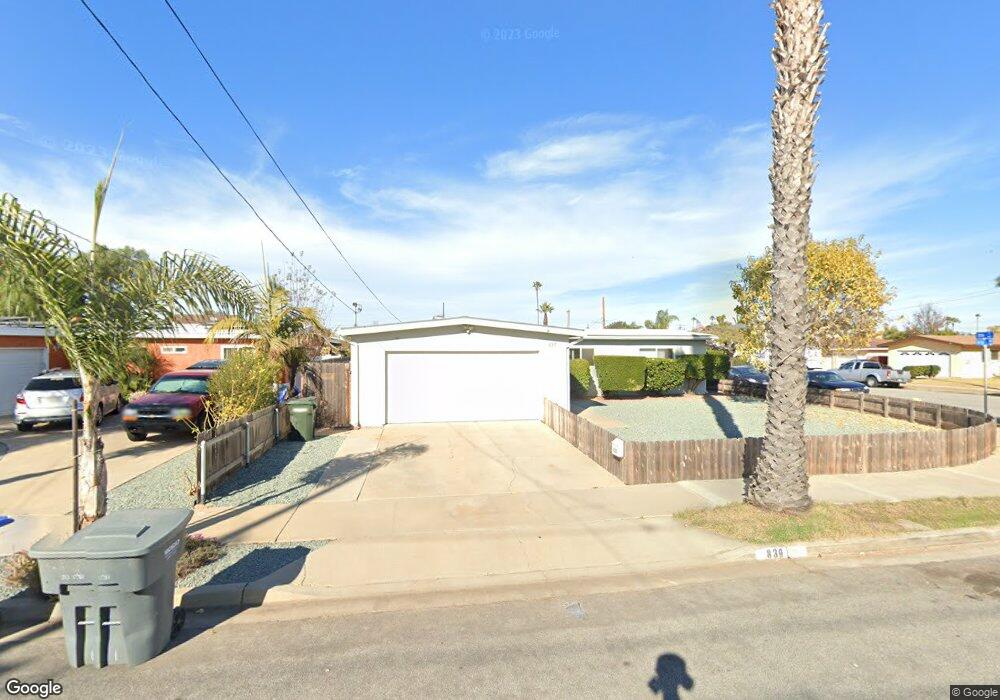
830 Iris Ave Imperial Beach, CA 91932
Estimated Value: $761,696 - $891,000
3
Beds
2
Baths
1,008
Sq Ft
$812/Sq Ft
Est. Value
About This Home
This home is located at 830 Iris Ave, Imperial Beach, CA 91932 and is currently estimated at $818,924, approximately $812 per square foot. 830 Iris Ave is a home located in San Diego County with nearby schools including Oneonta Elementary School, Mar Vista Academy, and Mar Vista Senior High School.
Ownership History
Date
Name
Owned For
Owner Type
Purchase Details
Closed on
Jan 5, 2021
Sold by
Willis Patrick M
Bought by
Willis Patrick M and Patrick M Willis Trust
Current Estimated Value
Home Financials for this Owner
Home Financials are based on the most recent Mortgage that was taken out on this home.
Original Mortgage
$187,000
Outstanding Balance
$166,898
Interest Rate
2.71%
Mortgage Type
New Conventional
Estimated Equity
$652,026
Purchase Details
Closed on
Nov 9, 2011
Sold by
Willis Patrick M
Bought by
Willis Patrick M
Purchase Details
Closed on
Mar 16, 2010
Sold by
Chupa John A
Bought by
Willis Patrick M
Home Financials for this Owner
Home Financials are based on the most recent Mortgage that was taken out on this home.
Original Mortgage
$221,250
Interest Rate
4.95%
Mortgage Type
New Conventional
Purchase Details
Closed on
Sep 23, 1985
Create a Home Valuation Report for This Property
The Home Valuation Report is an in-depth analysis detailing your home's value as well as a comparison with similar homes in the area
Home Values in the Area
Average Home Value in this Area
Purchase History
| Date | Buyer | Sale Price | Title Company |
|---|---|---|---|
| Willis Patrick M | -- | Accommodation | |
| Willis Patrick M | -- | Netco Title | |
| Willis Patrick M | -- | Chicago Title Company | |
| Willis Patrick M | $295,000 | Chicago Title Company | |
| -- | $82,000 | -- |
Source: Public Records
Mortgage History
| Date | Status | Borrower | Loan Amount |
|---|---|---|---|
| Open | Willis Patrick M | $187,000 | |
| Closed | Willis Patrick M | $221,250 |
Source: Public Records
Tax History
| Year | Tax Paid | Tax Assessment Tax Assessment Total Assessment is a certain percentage of the fair market value that is determined by local assessors to be the total taxable value of land and additions on the property. | Land | Improvement |
|---|---|---|---|---|
| 2025 | $4,724 | $380,774 | $251,701 | $129,073 |
| 2024 | $4,724 | $373,309 | $246,766 | $126,543 |
| 2023 | $4,733 | $365,990 | $241,928 | $124,062 |
| 2022 | $4,699 | $358,815 | $237,185 | $121,630 |
| 2021 | $4,634 | $351,781 | $232,535 | $119,246 |
| 2020 | $4,418 | $348,175 | $230,151 | $118,024 |
| 2019 | $4,392 | $341,349 | $225,639 | $115,710 |
| 2018 | $4,323 | $334,657 | $221,215 | $113,442 |
| 2017 | $4,202 | $328,096 | $216,878 | $111,218 |
| 2016 | $4,021 | $321,664 | $212,626 | $109,038 |
| 2015 | $3,980 | $316,834 | $209,433 | $107,401 |
| 2014 | $3,924 | $310,629 | $205,331 | $105,298 |
Source: Public Records
Map
Nearby Homes
Your Personal Tour Guide
Ask me questions while you tour the home.