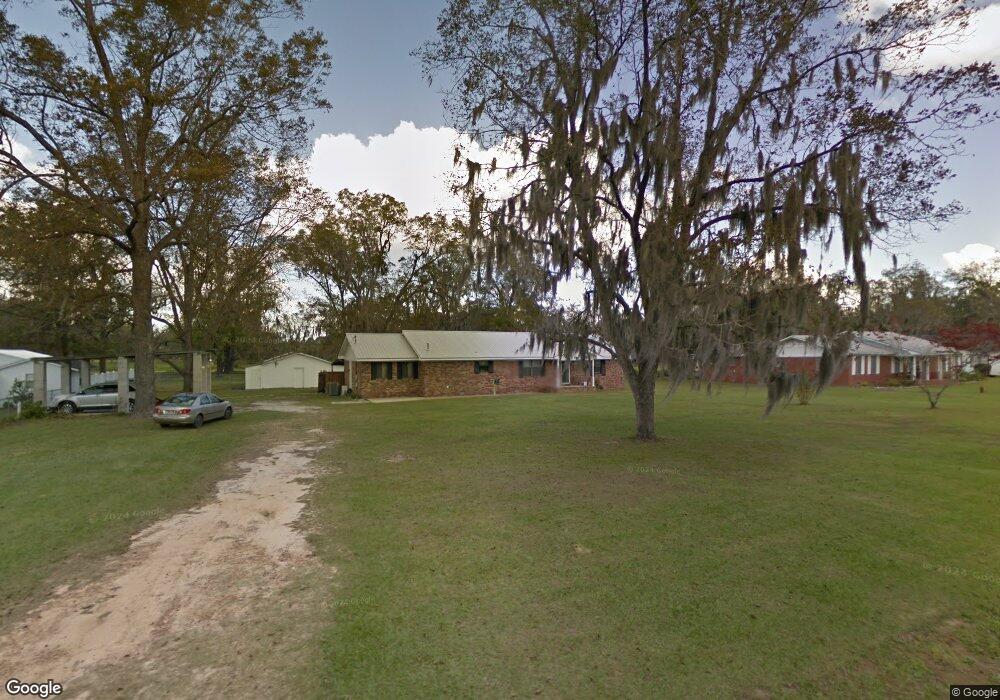
830 Strickland Ave Blackshear, GA 31516
Estimated Value: $202,000 - $242,000
3
Beds
2
Baths
2,202
Sq Ft
$102/Sq Ft
Est. Value
About This Home
This home is located at 830 Strickland Ave, Blackshear, GA 31516 and is currently estimated at $225,354, approximately $102 per square foot. 830 Strickland Ave is a home located in Pierce County with nearby schools including Pierce County High School, Southeast Christian Academy, and Truth Christian Academy.
Ownership History
Date
Name
Owned For
Owner Type
Purchase Details
Closed on
Apr 28, 2010
Sold by
Dennison James W
Bought by
Dennison Ian Clay
Current Estimated Value
Purchase Details
Closed on
Jan 30, 1995
Sold by
Dennison James W and Dennison Linda G
Bought by
Dennison Ian Clay
Purchase Details
Closed on
Jun 1, 1994
Sold by
Dennison Woodrow W and Dennison Elizabeth J
Bought by
Dennison James W and Dennison Linda G
Purchase Details
Closed on
May 10, 1978
Sold by
Carter Joseph E and Lamar Manders
Bought by
Dennison Woodrow and Dennison Elizabeth J
Purchase Details
Closed on
Jul 1, 1977
Sold by
Carter Michael D
Bought by
Carter Michael D and Carter Sue
Purchase Details
Closed on
May 22, 1964
Sold by
Roberson Flora
Bought by
Strickland Wiley Shelton
Purchase Details
Closed on
Jan 4, 1959
Sold by
Mccall Virgie Fka Virgie Roberson Ing
Bought by
Roberson Flora
Purchase Details
Closed on
Jan 4, 1958
Sold by
Williams Layman
Bought by
Inglis Inglis S and Inglis Virgie R
Purchase Details
Closed on
Jun 9, 1950
Sold by
Williams Layman
Bought by
Inglis Inglis S and Inglis Virgie R
Create a Home Valuation Report for This Property
The Home Valuation Report is an in-depth analysis detailing your home's value as well as a comparison with similar homes in the area
Home Values in the Area
Average Home Value in this Area
Purchase History
| Date | Buyer | Sale Price | Title Company |
|---|---|---|---|
| Dennison Ian Clay | -- | -- | |
| Dennison Ian Clay | -- | -- | |
| Dennison James W | -- | -- | |
| Dennison Woodrow | -- | -- | |
| Carter Michael D | -- | -- | |
| Strickland Wiley Shelton | -- | -- | |
| Roberson Flora | -- | -- | |
| Inglis Inglis S | -- | -- | |
| Inglis Inglis S | -- | -- |
Source: Public Records
Tax History
| Year | Tax Paid | Tax Assessment Tax Assessment Total Assessment is a certain percentage of the fair market value that is determined by local assessors to be the total taxable value of land and additions on the property. | Land | Improvement |
|---|---|---|---|---|
| 2025 | $2,665 | $80,716 | $5,580 | $75,136 |
| 2024 | $2,482 | $77,392 | $5,580 | $71,812 |
| 2023 | $2,466 | $76,910 | $5,580 | $71,330 |
| 2022 | $1,979 | $52,105 | $6,784 | $45,321 |
| 2021 | $2,052 | $50,184 | $6,784 | $43,400 |
| 2020 | $2,144 | $51,772 | $6,784 | $44,988 |
| 2019 | $2,144 | $51,772 | $6,784 | $44,988 |
| 2018 | $2,070 | $49,851 | $6,784 | $43,067 |
| 2017 | $2,028 | $48,699 | $6,784 | $41,915 |
| 2016 | $1,993 | $47,974 | $6,784 | $41,190 |
| 2015 | $1,591 | $47,974 | $6,784 | $41,190 |
| 2014 | $1,591 | $47,975 | $6,784 | $41,190 |
| 2013 | $1,591 | $47,974 | $6,784 | $41,190 |
Source: Public Records
Map
Nearby Homes
- 106 Southern Oaks Ln
- 3551 Cason Rd
- 3360 Strickland Avenue Extension
- 3344 Strickland Ave
- 402 Mcgregor St
- 315 Strickland Ave
- 00 Yeomans St
- 4055 Tamrose Ct
- 3026 Aragon Ct
- 241 Strickland Ave
- 6034 Turkey Oak Rd
- 2936 Piney Grove Cir
- 121 Beaver Dr
- 543 Church St
- 131 Fawn Ln
- 420 Greenleaf St
- 121 Trapper Trail
- 331 Central Ave W
- ST. ROUTE 121 Georgia 121
- 517 Lazy Ln
- 838 Strickland Ave
- 912 Strickland Ave
- 828 Strickland Ave
- 000 Strickland Ave
- 835 Strickland Ave
- 855 Strickland Ave
- 812 Strickland Ave
- 100 Yeomans St
- 920 Strickland Ave
- 128 Rose Austin Ln
- 802 Strickland Ave
- 130 Rose Austin Ln
- 341 Walker St
- 324 Walker St
- 320 Walker St
- 136 Rose Austin Ln
- 106 Yeomans St
- 1010 Strickland Ave
- 728 Strickland Ave
- 727 Strickland Ave
Your Personal Tour Guide
Ask me questions while you tour the home.