Estimated Value: $778,000 - $812,000
3
Beds
2
Baths
1,996
Sq Ft
$396/Sq Ft
Est. Value
About This Home
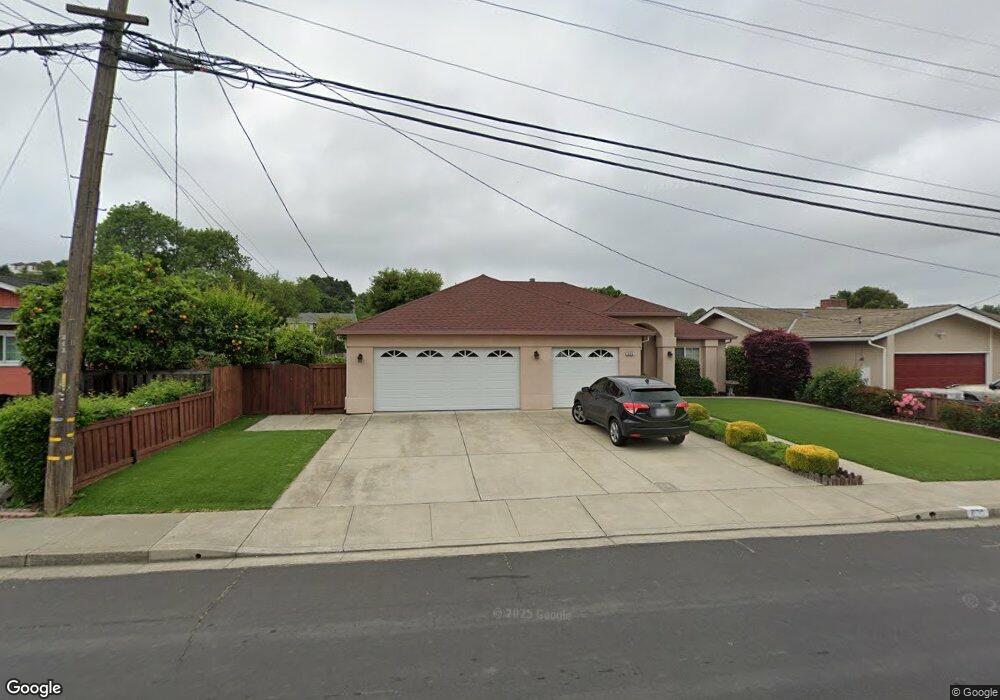
This home is located at 830 Vaqueros Ave, Rodeo, CA 94572 and is currently estimated at $791,225, approximately $396 per square foot. 830 Vaqueros Ave is a home located in Contra Costa County with nearby schools including Rodeo Hills Elementary School, Carquinez Middle School, and John Swett High School.
Ownership History
Date
Name
Owned For
Owner Type
Purchase Details
Closed on
Jul 13, 2019
Sold by
Miranda Federico J and Miranda Raquel B
Bought by
Miranda Raquel B and Miranda Federico J
Current Estimated Value
Purchase Details
Closed on
Oct 16, 2015
Sold by
Ferreira George A
Bought by
Miranda Frederico J and Miranda Raquel B
Home Financials for this Owner
Home Financials are based on the most recent Mortgage that was taken out on this home.
Original Mortgage
$393,750
Outstanding Balance
$159,562
Interest Rate
3.86%
Mortgage Type
New Conventional
Estimated Equity
$631,663
Purchase Details
Closed on
May 7, 2014
Sold by
Ferreira George A
Bought by
Ferreira George A
Purchase Details
Closed on
Jun 15, 2000
Sold by
Bratton Patricia A Tre
Bought by
Ferreira George A and Gaunt Betty J
Purchase Details
Closed on
Nov 20, 1995
Sold by
Bratton Patricia A
Bought by
Bratton Patricia A
Create a Home Valuation Report for This Property
The Home Valuation Report is an in-depth analysis detailing your home's value as well as a comparison with similar homes in the area
Home Values in the Area
Average Home Value in this Area
Purchase History
| Date | Buyer | Sale Price | Title Company |
|---|---|---|---|
| Miranda Raquel B | -- | None Available | |
| Miranda Frederico J | $525,000 | Old Republic Title Company | |
| Miranda Federico J | -- | Old Republic Title Company | |
| Ferreira George A | -- | None Available | |
| Gaunt Betty J | -- | None Available | |
| Ferreira George A | $70,000 | Old Republic Title Company | |
| Bratton Patricia A | -- | -- |
Source: Public Records
Mortgage History
| Date | Status | Borrower | Loan Amount |
|---|---|---|---|
| Open | Miranda Frederico J | $393,750 |
Source: Public Records
Tax History
| Year | Tax Paid | Tax Assessment Tax Assessment Total Assessment is a certain percentage of the fair market value that is determined by local assessors to be the total taxable value of land and additions on the property. | Land | Improvement |
|---|---|---|---|---|
| 2025 | $8,805 | $621,485 | $224,917 | $396,568 |
| 2024 | $8,579 | $609,300 | $220,507 | $388,793 |
| 2023 | $8,579 | $597,354 | $216,184 | $381,170 |
| 2022 | $8,451 | $585,643 | $211,946 | $373,697 |
| 2021 | $8,286 | $574,161 | $207,791 | $366,370 |
| 2019 | $8,086 | $557,133 | $201,629 | $355,504 |
| 2018 | $7,858 | $546,210 | $197,676 | $348,534 |
| 2017 | $7,718 | $535,500 | $193,800 | $341,700 |
| 2016 | $7,121 | $525,000 | $190,000 | $335,000 |
| 2015 | $4,983 | $337,684 | $89,514 | $248,170 |
| 2014 | $4,983 | $331,070 | $87,761 | $243,309 |
Source: Public Records
Map
Nearby Homes
- 836 Hawthorne Dr
- 909 Seascape Cir
- 601 Napa Ave
- 834 Coral Ridge Cir
- 106 White Cap Cove
- 943 Coral Ridge Cir
- 801 Dover
- 704 Windsor Unit 704
- 120 Bonita Ct
- 1334 7th St
- 405 Weymouth
- 343 Rodeo Ave
- 1012 Rock Harbor Point
- 215 4th St
- 1027 3rd St
- 720 Seacliff Ct
- 229 Lake Ave
- 220 Vaqueros Ave
- 922 Coral Dr
- 890 Tradewind Ln
- 824 Vaqueros Ave
- 790 Hawthorne Dr
- 818 Vaqueros Ave
- 829 Vaqueros Ave
- 835 Vaqueros Ave
- 823 Vaqueros Ave
- 808 Edward Werth Dr
- 804 Edward Werth Dr
- 812 Vaqueros Ave
- 812 Edward Werth Dr
- 800 Edward Werth Dr
- 796 Edward Werth Dr
- 842 Vaqueros Ave
- 801 Hawthorne Dr
- 807 Elm Dr
- 792 Edward Werth Dr
- 806 Vaqueros Ave
- 813 Vaqueros Ave
- 788 Edward Werth Dr
- 807 Edward Werth Dr
Your Personal Tour Guide
Ask me questions while you tour the home.