Oceanview Village Condos 8300 Oceanview Terrace Unit 409 San Francisco, CA 94132
Ingleside Heights NeighborhoodEstimated Value: $532,838 - $552,000
1
Bed
1
Bath
686
Sq Ft
$796/Sq Ft
Est. Value
About This Home
This home is located at 8300 Oceanview Terrace Unit 409, San Francisco, CA 94132 and is currently estimated at $545,960, approximately $795 per square foot. 8300 Oceanview Terrace Unit 409 is a home located in San Francisco County with nearby schools including Ortega (Jose) Elementary School, Aptos Middle School, and Krouzian-Zekarian-Vasbouragan Armenian School.
Ownership History
Date
Name
Owned For
Owner Type
Purchase Details
Closed on
Feb 20, 2013
Sold by
Jay Gilbert Y
Bought by
Perlin Vadim and Perlin Zinaida
Current Estimated Value
Purchase Details
Closed on
Nov 17, 2008
Sold by
Ogden Russel E and Ogden Linda A
Bought by
Sung Paul K
Home Financials for this Owner
Home Financials are based on the most recent Mortgage that was taken out on this home.
Original Mortgage
$250,000
Interest Rate
5.9%
Mortgage Type
Purchase Money Mortgage
Purchase Details
Closed on
Feb 17, 2005
Sold by
Ogden Russel E and Ogden Linda A
Bought by
Ogden Russel E and Ogden Linda A
Home Financials for this Owner
Home Financials are based on the most recent Mortgage that was taken out on this home.
Original Mortgage
$225,000
Interest Rate
4.87%
Mortgage Type
Purchase Money Mortgage
Purchase Details
Closed on
Dec 23, 2003
Sold by
3995 Alemany Development Lp
Bought by
Ogden Russel E and Ogden Linda A
Create a Home Valuation Report for This Property
The Home Valuation Report is an in-depth analysis detailing your home's value as well as a comparison with similar homes in the area
Home Values in the Area
Average Home Value in this Area
Purchase History
| Date | Buyer | Sale Price | Title Company |
|---|---|---|---|
| Perlin Vadim | $320,500 | First American Title Company | |
| Sung Paul K | $350,000 | Fidelity National Title Co | |
| Ogden Russel E | -- | Chicago Title Company | |
| Ogden Russel E | $370,500 | Old Republic Title Company |
Source: Public Records
Mortgage History
| Date | Status | Borrower | Loan Amount |
|---|---|---|---|
| Previous Owner | Sung Paul K | $250,000 | |
| Previous Owner | Ogden Russel E | $225,000 |
Source: Public Records
Tax History Compared to Growth
Tax History
| Year | Tax Paid | Tax Assessment Tax Assessment Total Assessment is a certain percentage of the fair market value that is determined by local assessors to be the total taxable value of land and additions on the property. | Land | Improvement |
|---|---|---|---|---|
| 2025 | $5,339 | $394,154 | $197,077 | $197,077 |
| 2024 | $5,339 | $386,426 | $193,213 | $193,213 |
| 2023 | $5,241 | $378,850 | $189,425 | $189,425 |
| 2022 | $5,126 | $371,422 | $185,711 | $185,711 |
| 2021 | $5,031 | $364,140 | $182,070 | $182,070 |
| 2020 | $5,121 | $360,408 | $180,204 | $180,204 |
| 2019 | $4,902 | $353,342 | $176,671 | $176,671 |
| 2018 | $4,739 | $346,414 | $173,207 | $173,207 |
| 2017 | $4,385 | $339,622 | $169,811 | $169,811 |
| 2016 | $4,290 | $332,964 | $166,482 | $166,482 |
| 2015 | $4,235 | $327,964 | $163,982 | $163,982 |
| 2014 | $4,667 | $367,668 | $183,834 | $183,834 |
Source: Public Records
About Oceanview Village Condos
Map
Nearby Homes
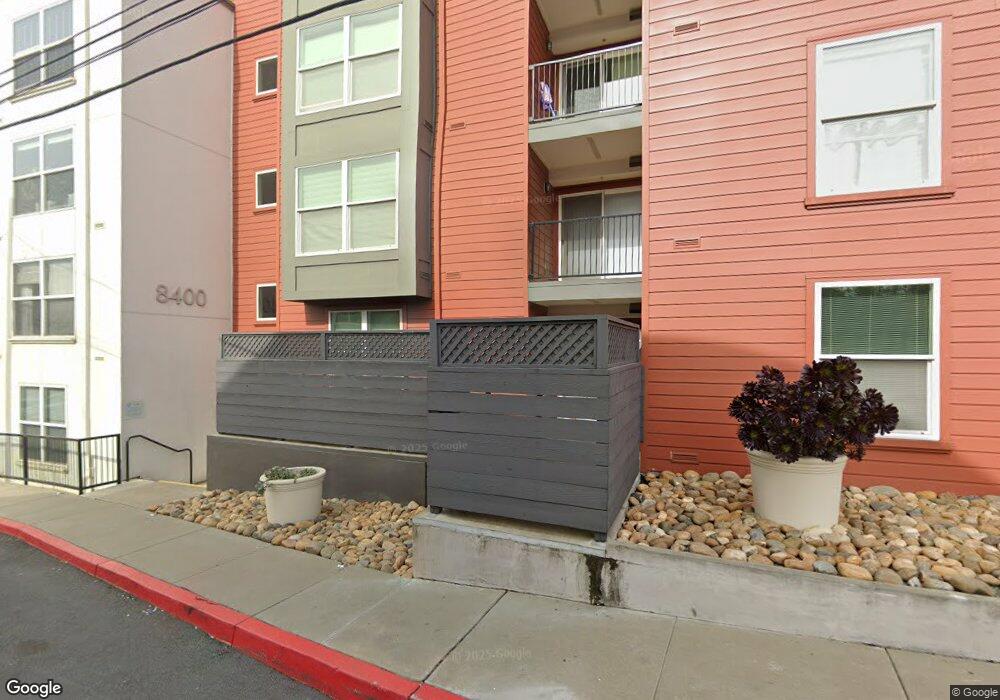
- 8400 Oceanview Terrace Unit 305
- 8400 Oceanview Terrace Unit 309
- 15 Belle Ave
- 140 Saint Charles Ave
- 95 Santa Cruz Ave
- 230 Rhine St
- 119 Vernon St
- 299 Sagamore St
- 263 Rhine St
- 19 Willits St
- 501 Sargent St
- 234 Sagamore St
- 475 Head St
- 233 Sargent St
- 230 Ralston St
- 125 Sargent St
- 58 N Mayfair Ave
- 134 Monticello St
- 73 Summit Way
- 3223 San Jose Ave
- 8300 Oceanview Terrace Unit 205
- 8300 Oceanview Terrace Unit 405
- 8300 Oceanview Terrace Unit 216
- 8300 Oceanview Terrace Unit 214
- 8300 Oceanview Terrace Unit 204
- 8300 Oceanview Terrace Unit 203
- 8300 Oceanview Terrace Unit 115
- 8300 Oceanview Terrace Unit 105
- 8300 Oceanview Terrace Unit 103
- 8300 Oceanview Terrace Unit 309
- 8300 Oceanview Terrace Unit 101
- 8300 Oceanview Terrace Unit 315
- 8300 Oceanview Terrace Unit 201
- 8300 Oceanview Terrace Unit 414
- 8300 Oceanview Terrace Unit 108
- 8300 Oceanview Terrace Unit 301
- 8300 Oceanview Terrace Unit 402
- 8300 Oceanview Terrace Unit 406
- 8300 Oceanview Terrace Unit 408
- 8300 Oceanview Terrace Unit 213