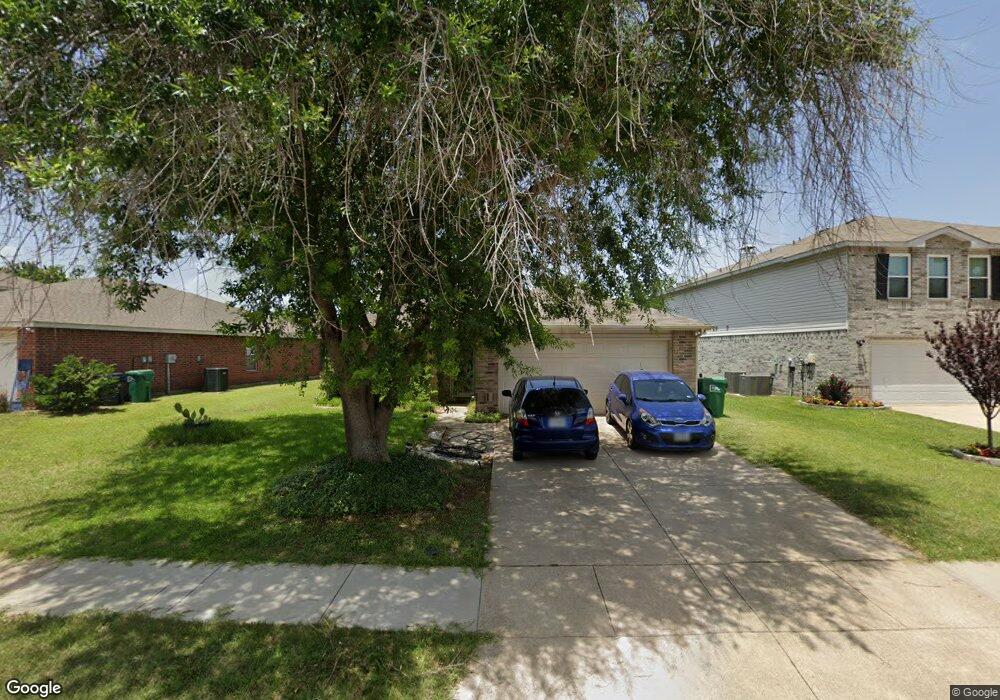
8304 Swan Park Dr Denton, TX 76210
South Denton NeighborhoodEstimated Value: $322,000 - $345,524
3
Beds
2
Baths
1,868
Sq Ft
$179/Sq Ft
Est. Value
About This Home
This home is located at 8304 Swan Park Dr, Denton, TX 76210 and is currently estimated at $333,631, approximately $178 per square foot. 8304 Swan Park Dr is a home located in Denton County with nearby schools including McNair Elementary School, Harpool Middle School, and Guyer High School.
Ownership History
Date
Name
Owned For
Owner Type
Purchase Details
Closed on
Nov 13, 2017
Sold by
Killham D Lynn Lei
Bought by
Levin Joshua David and Levin Lauren Peek
Current Estimated Value
Home Financials for this Owner
Home Financials are based on the most recent Mortgage that was taken out on this home.
Original Mortgage
$203,700
Outstanding Balance
$170,691
Interest Rate
3.85%
Mortgage Type
New Conventional
Estimated Equity
$162,940
Purchase Details
Closed on
Jul 30, 2009
Sold by
Reeder Jason Allan and Reeder Tiana Rae
Bought by
Killham Dlynn L
Home Financials for this Owner
Home Financials are based on the most recent Mortgage that was taken out on this home.
Original Mortgage
$129,609
Interest Rate
5.41%
Mortgage Type
FHA
Purchase Details
Closed on
Dec 13, 2001
Sold by
Centex Homes
Bought by
Reeder Jason Allan and Reeder Tiana Rae
Home Financials for this Owner
Home Financials are based on the most recent Mortgage that was taken out on this home.
Original Mortgage
$117,841
Interest Rate
6.52%
Mortgage Type
FHA
Create a Home Valuation Report for This Property
The Home Valuation Report is an in-depth analysis detailing your home's value as well as a comparison with similar homes in the area
Home Values in the Area
Average Home Value in this Area
Purchase History
| Date | Buyer | Sale Price | Title Company |
|---|---|---|---|
| Levin Joshua David | -- | Freedom Title | |
| Killham Dlynn L | -- | Stc | |
| Reeder Jason Allan | -- | -- |
Source: Public Records
Mortgage History
| Date | Status | Borrower | Loan Amount |
|---|---|---|---|
| Open | Levin Joshua David | $203,700 | |
| Previous Owner | Killham Dlynn L | $129,609 | |
| Previous Owner | Reeder Jason Allan | $117,841 |
Source: Public Records
Tax History Compared to Growth
Tax History
| Year | Tax Paid | Tax Assessment Tax Assessment Total Assessment is a certain percentage of the fair market value that is determined by local assessors to be the total taxable value of land and additions on the property. | Land | Improvement |
|---|---|---|---|---|
| 2025 | $4,898 | $329,433 | $77,495 | $251,938 |
| 2024 | $6,094 | $315,715 | $0 | $0 |
| 2023 | $4,283 | $287,014 | $77,495 | $262,754 |
| 2022 | $5,539 | $260,922 | $77,495 | $221,946 |
| 2021 | $5,273 | $240,660 | $56,060 | $184,600 |
| 2020 | $4,929 | $215,638 | $56,060 | $159,578 |
| 2019 | $5,143 | $215,551 | $56,060 | $159,491 |
| 2018 | $4,869 | $201,559 | $45,021 | $156,538 |
| 2017 | $4,187 | $169,400 | $45,021 | $136,984 |
| 2016 | $3,675 | $154,000 | $34,730 | $133,748 |
| 2015 | $3,112 | $140,000 | $34,730 | $105,270 |
| 2013 | -- | $133,089 | $34,000 | $99,089 |
Source: Public Records
Map
Nearby Homes
- 7912 Hidden Path Ln
- 7804 Hidden Path Ln
- 8404 Glen Falls Ln
- 8704 Serenity Way
- 1612 Marble Cove Ln
- 8813 Swan Park Dr
- 8204 Montecito Dr
- 2109 Doecrest Dr
- 7305 Mira Vista Dr
- 1217 Golden Sand Dr
- 7301 Chaucer Dr
- 1617 Glendora Ct
- 2067 Leatherwood Ln
- 7100 Frost Ln
- 1605 Cordero Ct
- 2912 Lighthouse Dr
- 1569 Stanford Ct
- 1201 Buena Vista Dr
- 5029 Coral Cove
- 2109 Hemingway Dr
- 8308 Swan Park Dr
- 8300 Swan Park Dr
- 8400 Swan Park Dr
- 8305 Serenity Way
- 8301 Serenity Way
- 8309 Serenity Way
- 8404 Swan Park Dr
- 8305 Swan Park Dr
- 8301 Swan Park Dr
- 8309 Swan Park Dr
- 8208 Swan Park Dr
- 8313 Serenity Way
- 8401 Swan Park Dr
- 8408 Swan Park Dr
- 8209 Serenity Way
- 8405 Swan Park Dr
- 8209 Swan Park Dr
- 8004 Montecito Dr
- 8204 Swan Park Dr
- 8401 Serenity Way