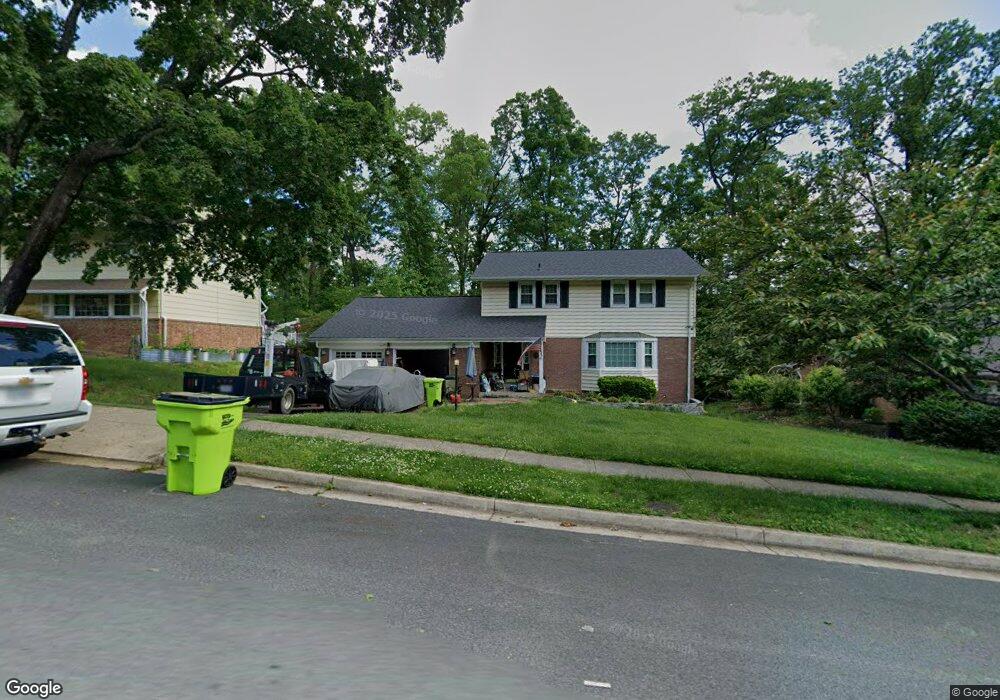
8306 Oakford Dr Springfield, VA 22152
Estimated Value: $792,000 - $930,000
4
Beds
3
Baths
2,196
Sq Ft
$397/Sq Ft
Est. Value
About This Home
This home is located at 8306 Oakford Dr, Springfield, VA 22152 and is currently estimated at $872,432, approximately $397 per square foot. 8306 Oakford Dr is a home located in Fairfax County with nearby schools including Cardinal Forest Elementary School, Irving Middle School, and West Springfield High School.
Ownership History
Date
Name
Owned For
Owner Type
Purchase Details
Closed on
Sep 28, 2006
Sold by
Smith Bruce
Bought by
Keane Catherine L
Current Estimated Value
Home Financials for this Owner
Home Financials are based on the most recent Mortgage that was taken out on this home.
Original Mortgage
$375,000
Outstanding Balance
$224,141
Interest Rate
6.49%
Mortgage Type
New Conventional
Estimated Equity
$648,291
Purchase Details
Closed on
May 24, 2004
Sold by
Cole Gregory S
Bought by
Smith Bruce
Home Financials for this Owner
Home Financials are based on the most recent Mortgage that was taken out on this home.
Original Mortgage
$392,300
Interest Rate
5.75%
Mortgage Type
New Conventional
Purchase Details
Closed on
Nov 1, 1999
Sold by
Stassi Paul P
Bought by
Coale Gregory S
Home Financials for this Owner
Home Financials are based on the most recent Mortgage that was taken out on this home.
Original Mortgage
$190,000
Interest Rate
7.78%
Create a Home Valuation Report for This Property
The Home Valuation Report is an in-depth analysis detailing your home's value as well as a comparison with similar homes in the area
Home Values in the Area
Average Home Value in this Area
Purchase History
| Date | Buyer | Sale Price | Title Company |
|---|---|---|---|
| Keane Catherine L | $550,000 | -- | |
| Smith Bruce | $492,300 | -- | |
| Coale Gregory S | $215,000 | -- |
Source: Public Records
Mortgage History
| Date | Status | Borrower | Loan Amount |
|---|---|---|---|
| Open | Keane Catherine L | $375,000 | |
| Previous Owner | Smith Bruce | $392,300 | |
| Previous Owner | Coale Gregory S | $190,000 |
Source: Public Records
Tax History Compared to Growth
Tax History
| Year | Tax Paid | Tax Assessment Tax Assessment Total Assessment is a certain percentage of the fair market value that is determined by local assessors to be the total taxable value of land and additions on the property. | Land | Improvement |
|---|---|---|---|---|
| 2025 | $9,360 | $845,700 | $306,000 | $539,700 |
| 2024 | $9,360 | $807,980 | $286,000 | $521,980 |
| 2023 | $8,559 | $758,460 | $266,000 | $492,460 |
| 2022 | $8,265 | $722,790 | $251,000 | $471,790 |
| 2021 | $7,233 | $616,370 | $211,000 | $405,370 |
| 2020 | $7,188 | $607,360 | $206,000 | $401,360 |
| 2019 | $6,927 | $585,270 | $201,000 | $384,270 |
| 2018 | $6,648 | $578,090 | $201,000 | $377,090 |
| 2017 | $6,601 | $568,520 | $201,000 | $367,520 |
| 2016 | $6,422 | $554,380 | $201,000 | $353,380 |
| 2015 | $6,187 | $554,380 | $201,000 | $353,380 |
| 2014 | $6,173 | $554,380 | $201,000 | $353,380 |
Source: Public Records
Map
Nearby Homes
- 5944 Queenston St
- 8336 Forrester Blvd Unit 448
- 8330 Darlington St Unit 467
- 5901B Prince George Dr Unit 341
- 8372 Forrester Blvd Unit 478
- 8218 Carrleigh Pkwy Unit 10
- 8210 Carrleigh Pkwy Unit 6
- 8145 Carrleigh Pkwy
- 8344 Darlington St Unit 486
- 5909D Prince James Dr Unit D
- 8437 Forrester Blvd
- 5906D Bayshire Rd
- 8200 Old Oaks Dr
- 5824 Rexford Dr Unit 731
- 8519 Westover Ct Unit 763
- 5816 Torington Dr Unit 860
- 5921 Minutemen Rd Unit 246
- 5925 Minutemen Rd Unit 248
- 5778 Rexford Ct Unit 5778B
- 5800 Torington Dr Unit 836
- 8304 Oakford Dr
- 8308 Oakford Dr
- 8302 Oakford Dr
- 8310 Oakford Dr
- 8307 Oakford Dr
- 8309 Oakford Dr
- 8305 Oakford Dr
- 8312 Oakford Dr
- 8300 Oakford Dr
- 8311 Oakford Dr
- 8303 Oakford Dr
- 8301 Oakford Dr
- 8313 Oakford Dr
- 5972 Seabright Rd
- 5974 Seabright Rd
- 8264 Carrleigh Pkwy
- 8314 Oakford Dr
- 5976 Seabright Rd
- 8266 Carrleigh Pkwy
- 8268 Carrleigh Pkwy