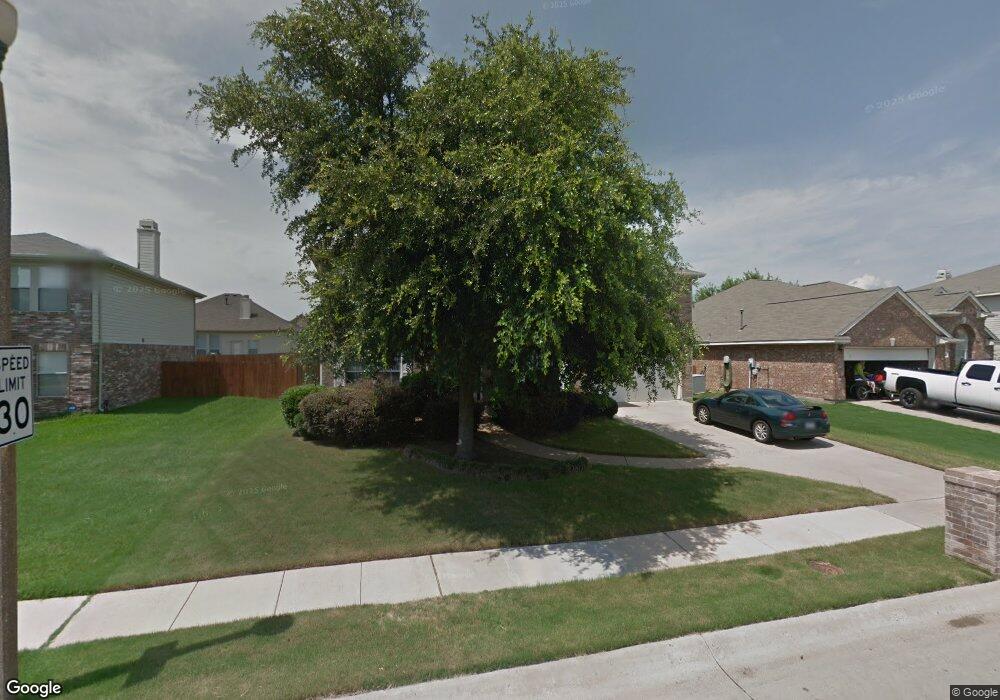
8309 Montecito Dr Denton, TX 76210
South Denton NeighborhoodEstimated Value: $353,000 - $407,000
4
Beds
3
Baths
2,698
Sq Ft
$136/Sq Ft
Est. Value
About This Home
This home is located at 8309 Montecito Dr, Denton, TX 76210 and is currently estimated at $367,403, approximately $136 per square foot. 8309 Montecito Dr is a home located in Denton County with nearby schools including McNair Elementary School, Harpool Middle School, and Guyer High School.
Ownership History
Date
Name
Owned For
Owner Type
Purchase Details
Closed on
Jan 15, 2016
Sold by
Glass Sheldon M and Glass Wanda R
Bought by
Phillips Kyle and Phillips Kara
Current Estimated Value
Home Financials for this Owner
Home Financials are based on the most recent Mortgage that was taken out on this home.
Original Mortgage
$191,468
Outstanding Balance
$152,108
Interest Rate
4.25%
Mortgage Type
FHA
Estimated Equity
$215,295
Purchase Details
Closed on
Jun 19, 2002
Sold by
Kbone Inc
Bought by
Glass Sheldon M and Glass Wanda R
Home Financials for this Owner
Home Financials are based on the most recent Mortgage that was taken out on this home.
Original Mortgage
$110,000
Interest Rate
6.89%
Purchase Details
Closed on
Aug 30, 1999
Sold by
Kaufman & Broad Of Texas Ltd
Bought by
Kbone Inc
Home Financials for this Owner
Home Financials are based on the most recent Mortgage that was taken out on this home.
Original Mortgage
$129,200
Interest Rate
8.13%
Create a Home Valuation Report for This Property
The Home Valuation Report is an in-depth analysis detailing your home's value as well as a comparison with similar homes in the area
Home Values in the Area
Average Home Value in this Area
Purchase History
| Date | Buyer | Sale Price | Title Company |
|---|---|---|---|
| Phillips Kyle | -- | Lawyers Title | |
| Glass Sheldon M | -- | -- | |
| Kbone Inc | -- | -- |
Source: Public Records
Mortgage History
| Date | Status | Borrower | Loan Amount |
|---|---|---|---|
| Open | Phillips Kyle | $191,468 | |
| Previous Owner | Glass Sheldon M | $110,000 | |
| Previous Owner | Kbone Inc | $129,200 |
Source: Public Records
Tax History
| Year | Tax Paid | Tax Assessment Tax Assessment Total Assessment is a certain percentage of the fair market value that is determined by local assessors to be the total taxable value of land and additions on the property. | Land | Improvement |
|---|---|---|---|---|
| 2025 | $5,372 | $345,356 | $77,440 | $267,916 |
| 2024 | $6,567 | $340,243 | $0 | $0 |
| 2023 | $4,709 | $309,312 | $77,440 | $299,721 |
| 2022 | $5,969 | $281,193 | $77,440 | $249,091 |
| 2021 | $5,683 | $255,630 | $42,240 | $213,390 |
| 2020 | $5,341 | $233,680 | $42,240 | $191,440 |
| 2019 | $5,522 | $231,424 | $42,240 | $189,184 |
| 2018 | $5,349 | $221,417 | $42,240 | $187,658 |
| 2017 | $4,975 | $201,288 | $38,720 | $162,568 |
| 2016 | $4,446 | $206,268 | $34,144 | $172,124 |
| 2015 | $3,844 | $170,978 | $34,144 | $136,834 |
| 2013 | -- | $148,235 | $29,920 | $118,315 |
Source: Public Records
Map
Nearby Homes
- 8133 Montecito Dr
- 2421 Windhaven Dr
- 5021 Split Rock Dr
- 5029 Coral Cove
- 2901 Saddle Dr
- 2067 Leatherwood Ln
- 8200 Mirror Rock Ln
- 1612 Marble Cove Ln
- 7100 Frost Ln
- 7016 Frost Ln
- 8704 Serenity Way
- 6828 Crenshaw Ln
- 8405 Seven Oaks Ln
- 2614 Dakota Cir
- 6601 Longleaf Ln
- 1617 Glendora Ct
- TBD Ryan Rd
- 6704 Alderbrook Dr
- 6713 Alderbrook Dr
- 1917 Prescott Downs Dr
- 8313 Montecito Dr
- 8305 Montecito Dr
- 2416 Acorn Bend
- 2412 Acorn Bend
- 2500 Acorn Bend
- 8301 Montecito Dr
- 8317 Montecito Dr
- 2504 Acorn Bend
- 2408 Acorn Bend
- 8312 Montecito Dr
- 8304 Montecito Dr
- 8229 Montecito Dr
- 8316 Montecito Dr
- 2404 Acorn Bend
- 8300 Montecito Dr
- 8320 Montecito Dr
- 8225 Montecito Dr
- 8213 Charter Bend
- 8228 Montecito Dr
- 2417 Acorn Bend
Your Personal Tour Guide
Ask me questions while you tour the home.