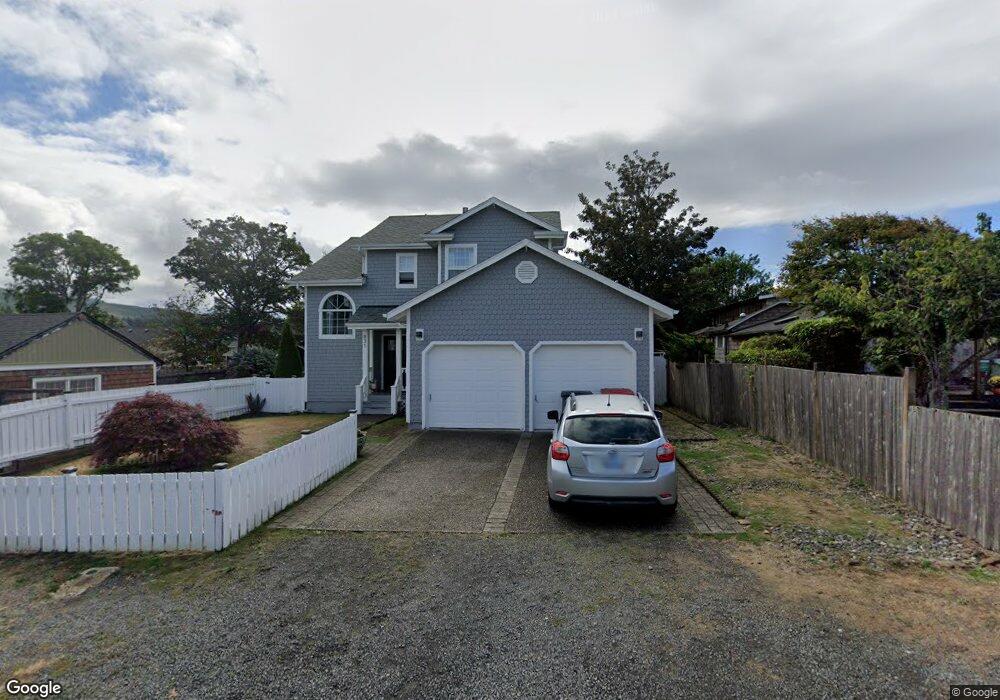
831 17th Ave Seaside, OR 97138
Estimated Value: $623,582 - $667,000
5
Beds
3
Baths
685
Sq Ft
$942/Sq Ft
Est. Value
About This Home
This home is located at 831 17th Ave, Seaside, OR 97138 and is currently estimated at $645,396, approximately $942 per square foot. 831 17th Ave is a home located in Clatsop County with nearby schools including Seaside High School.
Ownership History
Date
Name
Owned For
Owner Type
Purchase Details
Closed on
Apr 25, 2013
Sold by
Velazquez Pedro and Velazquez Maricela P
Bought by
Velazquez Melchor Pedro and Velazquez Maricela P
Current Estimated Value
Home Financials for this Owner
Home Financials are based on the most recent Mortgage that was taken out on this home.
Original Mortgage
$199,500
Interest Rate
3.6%
Mortgage Type
New Conventional
Purchase Details
Closed on
Jan 6, 2006
Sold by
Velazquez Pedro and Velazquez Maricella P
Bought by
Velazquez Pedro and Velazquez Maricela P
Home Financials for this Owner
Home Financials are based on the most recent Mortgage that was taken out on this home.
Original Mortgage
$174,000
Interest Rate
6.25%
Mortgage Type
New Conventional
Create a Home Valuation Report for This Property
The Home Valuation Report is an in-depth analysis detailing your home's value as well as a comparison with similar homes in the area
Home Values in the Area
Average Home Value in this Area
Purchase History
| Date | Buyer | Sale Price | Title Company |
|---|---|---|---|
| Velazquez Melchor Pedro | -- | Ticor Title Ins Co | |
| Velazquez Pedro | -- | Ticor Title Ins Co |
Source: Public Records
Mortgage History
| Date | Status | Borrower | Loan Amount |
|---|---|---|---|
| Closed | Velazquez Melchor Pedro | $199,500 | |
| Closed | Velazquez Pedro | $174,000 |
Source: Public Records
Tax History Compared to Growth
Tax History
| Year | Tax Paid | Tax Assessment Tax Assessment Total Assessment is a certain percentage of the fair market value that is determined by local assessors to be the total taxable value of land and additions on the property. | Land | Improvement |
|---|---|---|---|---|
| 2025 | $4,767 | $331,759 | -- | -- |
| 2024 | $4,627 | $322,097 | -- | -- |
| 2023 | $4,490 | $312,716 | $0 | $0 |
| 2022 | $4,368 | $303,609 | $0 | $0 |
| 2021 | $4,275 | $294,767 | $0 | $0 |
| 2020 | $4,175 | $286,183 | $0 | $0 |
| 2019 | $4,061 | $277,849 | $0 | $0 |
| 2018 | $3,900 | $269,758 | $0 | $0 |
| 2017 | $3,722 | $261,902 | $0 | $0 |
| 2016 | $3,274 | $254,274 | $51,969 | $202,305 |
| 2015 | $3,189 | $246,869 | $50,456 | $196,413 |
| 2014 | $3,179 | $239,680 | $0 | $0 |
| 2013 | -- | $232,700 | $0 | $0 |
Source: Public Records
Map
Nearby Homes