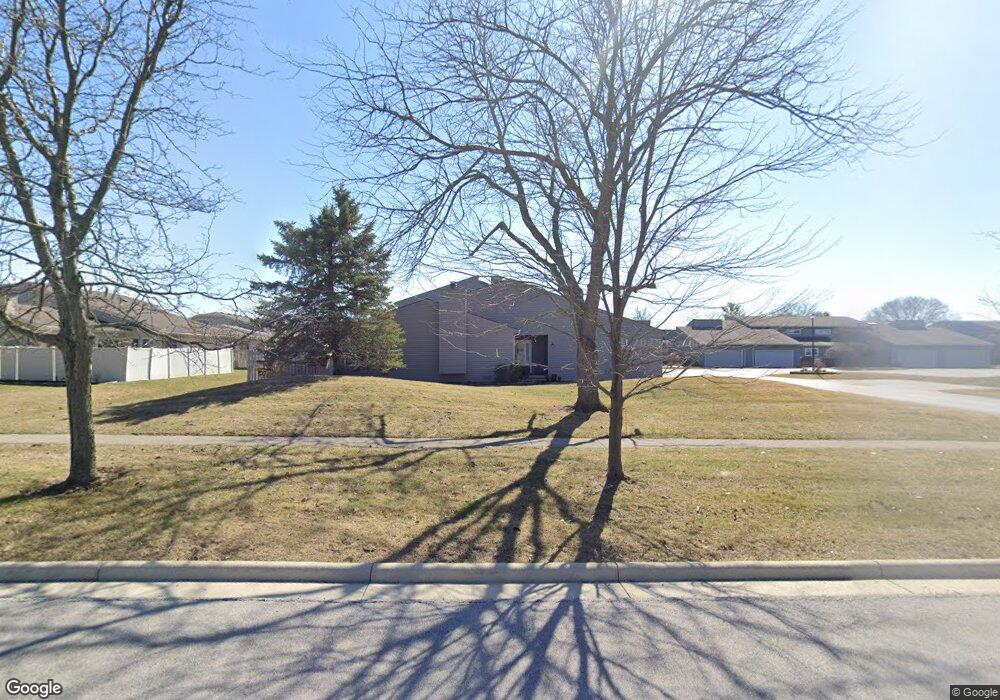
831 Fox Run Rd Unit U12 Findlay, OH 45840
Estimated Value: $214,000 - $246,000
2
Beds
2
Baths
1,372
Sq Ft
$167/Sq Ft
Est. Value
About This Home
This home is located at 831 Fox Run Rd Unit U12, Findlay, OH 45840 and is currently estimated at $229,367, approximately $167 per square foot. 831 Fox Run Rd Unit U12 is a home located in Hancock County with nearby schools including Wilson Vance Elementary School, Whittier Elementary School, and Glenwood Middle School.
Ownership History
Date
Name
Owned For
Owner Type
Purchase Details
Closed on
Sep 18, 2020
Sold by
Flynn Eric A and Flynn Jan L
Bought by
Crates Andrew C B
Current Estimated Value
Purchase Details
Closed on
Jun 20, 2016
Sold by
Boes Theresa M
Bought by
Flynn Eric A and Flynn Jan L
Home Financials for this Owner
Home Financials are based on the most recent Mortgage that was taken out on this home.
Original Mortgage
$100,000
Interest Rate
3.57%
Mortgage Type
New Conventional
Purchase Details
Closed on
Mar 29, 1996
Sold by
Bakies R Sue
Bought by
Lawrence and Thomas Nancy
Home Financials for this Owner
Home Financials are based on the most recent Mortgage that was taken out on this home.
Original Mortgage
$50,000
Interest Rate
6.98%
Mortgage Type
New Conventional
Purchase Details
Closed on
May 15, 1992
Bought by
Bakies R Sue
Purchase Details
Closed on
Aug 13, 1986
Bought by
Gerken John R Jr Tr
Create a Home Valuation Report for This Property
The Home Valuation Report is an in-depth analysis detailing your home's value as well as a comparison with similar homes in the area
Home Values in the Area
Average Home Value in this Area
Purchase History
| Date | Buyer | Sale Price | Title Company |
|---|---|---|---|
| Crates Andrew C B | $182,900 | Whitman Title Security | |
| Flynn Eric A | $130,000 | Flag City Title | |
| Lawrence | $113,000 | -- | |
| Bakies R Sue | $89,000 | -- | |
| Gerken John R Jr Tr | -- | -- |
Source: Public Records
Mortgage History
| Date | Status | Borrower | Loan Amount |
|---|---|---|---|
| Previous Owner | Flynn Eric A | $100,000 | |
| Previous Owner | Lawrence | $50,000 |
Source: Public Records
Tax History Compared to Growth
Tax History
| Year | Tax Paid | Tax Assessment Tax Assessment Total Assessment is a certain percentage of the fair market value that is determined by local assessors to be the total taxable value of land and additions on the property. | Land | Improvement |
|---|---|---|---|---|
| 2024 | $2,099 | $59,090 | $3,680 | $55,410 |
| 2023 | $2,102 | $59,090 | $3,680 | $55,410 |
| 2022 | $2,095 | $59,090 | $3,680 | $55,410 |
| 2021 | $2,119 | $52,050 | $2,800 | $49,250 |
| 2020 | $2,118 | $52,050 | $2,800 | $49,250 |
| 2019 | $2,078 | $52,050 | $2,800 | $49,250 |
| 2018 | $1,951 | $44,890 | $2,800 | $42,090 |
| 2017 | $1,952 | $44,890 | $2,800 | $42,090 |
| 2016 | $1,926 | $44,890 | $2,800 | $42,090 |
| 2015 | $1,400 | $40,770 | $2,800 | $37,970 |
| 2014 | $1,400 | $40,770 | $2,800 | $37,970 |
| 2012 | $1,519 | $43,190 | $2,800 | $40,390 |
Source: Public Records
Map
Nearby Homes
- 801 Fox Run Rd
- 806 Woodstock Ct
- 828 Longmeadow Ln
- 822 Bright Rd
- 2252 Fox Run Cir
- 2000 Rush Creek Ct
- 505 Bright Rd
- 1926 Queenswood Dr
- 0 Meadowview Dr
- 1902 Queenswood Dr
- 1203 Chateau Ct
- 537 Bristol Dr
- 1825 Greendale Ave
- 1364 Chateau Cir Unit 31
- 1364 Chateau Cir Unit 26
- 1901 Imperial Ln
- 1303 Chateau Cir Unit 60
- 1812 Camelot Ln
- 1309 Chateau Cir Unit 63
- 1611 Brand Manor Dr Unit 5
- 831 Fox Run Rd Unit U11
- 831 Fox Run Rd Unit U10
- 821 Fox Run Rd Unit U9
- 821 Fox Run Rd Unit U8
- 821 Fox Run Rd Unit U7
- 821 Fox Run Rd Unit U6
- 821 Fox Run Rd Unit U5
- 821 Fox Run Rd Unit U4
- 821 Fox Run Rd
- 821 Fox Run U-9
- 847 Fox Run Rd Unit 2
- 851 Fox Run Rd Unit U4
- 849 Fox Run Rd Unit 3
- 845 Fox Run Rd
- 845 Fox Run Rd Unit U-1
- 857 Fox Run Rd
- 859 Fox Run Rd Unit U6
- 843 Fox Run Rd
- 843 Fox Run Rd Unit 19
- 853 Fox Run Rd