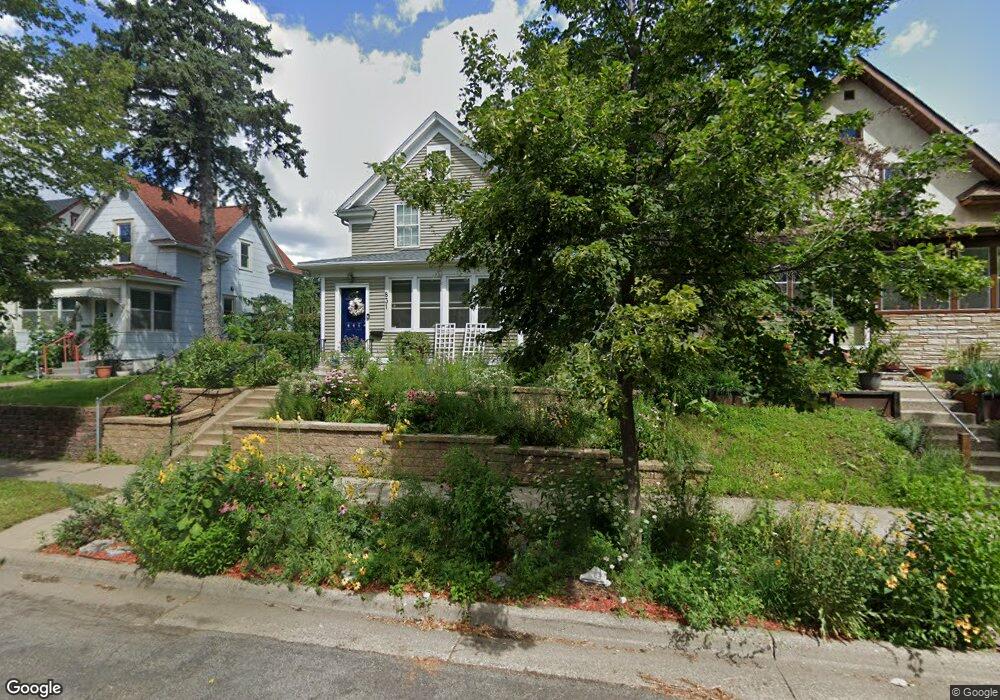
831 Thomas Ave Saint Paul, MN 55104
Frogtown NeighborhoodEstimated Value: $252,000 - $275,925
2
Beds
2
Baths
1,170
Sq Ft
$226/Sq Ft
Est. Value
About This Home
This home is located at 831 Thomas Ave, Saint Paul, MN 55104 and is currently estimated at $264,981, approximately $226 per square foot. 831 Thomas Ave is a home located in Ramsey County with nearby schools including Maxfield Magnet Elementary School, Hidden River Middle School, and Central Senior High School.
Ownership History
Date
Name
Owned For
Owner Type
Purchase Details
Closed on
Jun 18, 2020
Sold by
Saintpaulproperties Llc
Bought by
Franet Andrew and Beckham Lisa
Current Estimated Value
Home Financials for this Owner
Home Financials are based on the most recent Mortgage that was taken out on this home.
Original Mortgage
$209,000
Outstanding Balance
$185,263
Interest Rate
3.2%
Mortgage Type
New Conventional
Estimated Equity
$79,719
Purchase Details
Closed on
Nov 6, 2014
Purchase Details
Closed on
Mar 26, 2014
Sold by
Newton Neisha S
Bought by
Minnesota Housing Finance Agency
Purchase Details
Closed on
Nov 28, 2003
Sold by
Estate Of Xia Pao Xiong
Bought by
Xiong Vong and Vang Pao
Purchase Details
Closed on
Nov 24, 1997
Sold by
Aillancourt Louis A and Aillancourt Susan R
Bought by
Xiong Xia Pao
Create a Home Valuation Report for This Property
The Home Valuation Report is an in-depth analysis detailing your home's value as well as a comparison with similar homes in the area
Home Values in the Area
Average Home Value in this Area
Purchase History
| Date | Buyer | Sale Price | Title Company |
|---|---|---|---|
| Franet Andrew | $220,000 | Executive Title | |
| -- | $65,100 | -- | |
| Minnesota Housing Finance Agency | $164,701 | None Available | |
| Xiong Vong | $83,500 | -- | |
| Xiong Xia Pao | $58,660 | -- |
Source: Public Records
Mortgage History
| Date | Status | Borrower | Loan Amount |
|---|---|---|---|
| Open | Franet Andrew | $209,000 |
Source: Public Records
Tax History Compared to Growth
Tax History
| Year | Tax Paid | Tax Assessment Tax Assessment Total Assessment is a certain percentage of the fair market value that is determined by local assessors to be the total taxable value of land and additions on the property. | Land | Improvement |
|---|---|---|---|---|
| 2025 | $3,756 | $285,100 | $25,000 | $260,100 |
| 2023 | $3,756 | $251,400 | $20,000 | $231,400 |
| 2022 | $3,130 | $247,300 | $20,000 | $227,300 |
| 2021 | $2,544 | $206,800 | $10,100 | $196,700 |
| 2020 | $3,176 | $178,400 | $10,100 | $168,300 |
| 2019 | $2,958 | $161,700 | $10,100 | $151,600 |
| 2018 | $2,402 | $143,000 | $10,100 | $132,900 |
| 2017 | $2,332 | $118,300 | $11,200 | $107,100 |
| 2016 | $1,802 | $0 | $0 | $0 |
| 2015 | $1,408 | $89,800 | $11,200 | $78,600 |
| 2014 | $1,116 | $0 | $0 | $0 |
Source: Public Records
Map
Nearby Homes
- 818 Edmund Ave
- 852 Edmund Ave
- 885 Edmund Ave
- 877 Charles Ave
- 751 Van Buren Ave
- 730 Edmund Ave
- 876 Charles Ave
- 818 Sherburne Ave
- 873 Sherburne Ave
- 723 Charles Ave
- 838 Sherburne Ave
- 846 Sherburne Ave
- 679 Edmund Ave
- 931 Sherburne Ave
- 679 Charles Ave
- 653 Thomas Ave
- 646 Van Buren Ave
- 799 Fuller Ave
- 631 Van Buren Ave
- 639 Sherburne Ave