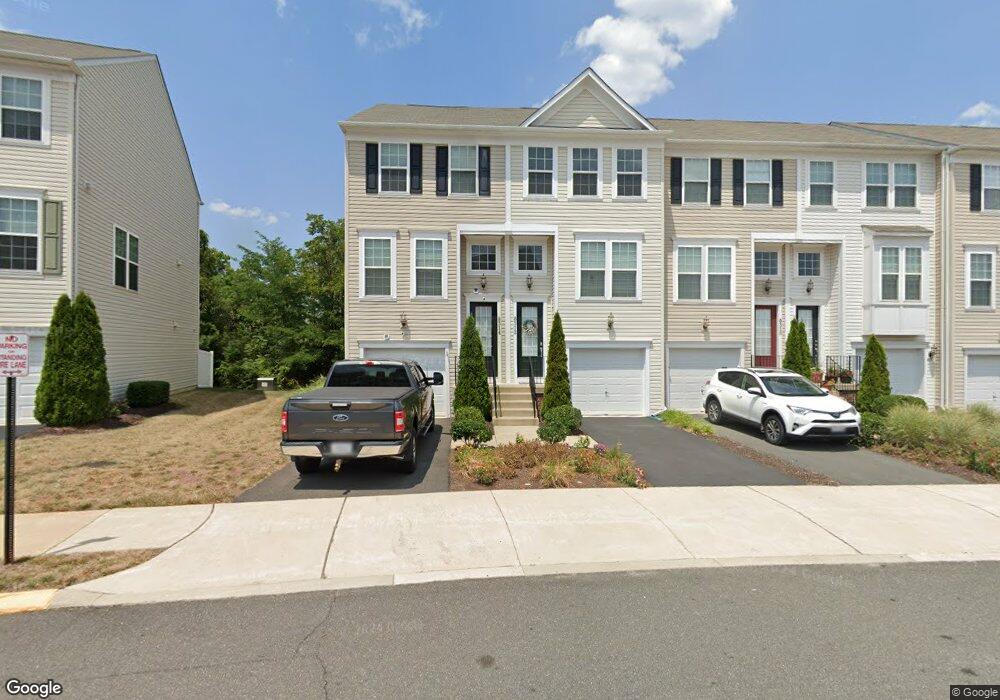
8312 Scotland Loop Manassas, VA 20109
Estimated Value: $414,696 - $476,000
3
Beds
3
Baths
1,470
Sq Ft
$307/Sq Ft
Est. Value
About This Home
This home is located at 8312 Scotland Loop, Manassas, VA 20109 and is currently estimated at $451,924, approximately $307 per square foot. 8312 Scotland Loop is a home located in Prince William County with nearby schools including Loch Lomond Elementary School, Parkside Middle School, and Osbourn Park High School.
Ownership History
Date
Name
Owned For
Owner Type
Purchase Details
Closed on
Jun 12, 2018
Sold by
Moonsammy Tristan Nicholas and Hu Yei Jin
Bought by
Osorto Nicolas and Majano Yolanda Patricia
Current Estimated Value
Home Financials for this Owner
Home Financials are based on the most recent Mortgage that was taken out on this home.
Original Mortgage
$270,000
Outstanding Balance
$233,505
Interest Rate
4.5%
Mortgage Type
New Conventional
Estimated Equity
$218,419
Purchase Details
Closed on
Sep 22, 2014
Sold by
Neighborhoods Iv Llc
Bought by
Moonsammy Tristan N
Home Financials for this Owner
Home Financials are based on the most recent Mortgage that was taken out on this home.
Original Mortgage
$270,440
Interest Rate
3.87%
Mortgage Type
FHA
Create a Home Valuation Report for This Property
The Home Valuation Report is an in-depth analysis detailing your home's value as well as a comparison with similar homes in the area
Home Values in the Area
Average Home Value in this Area
Purchase History
| Date | Buyer | Sale Price | Title Company |
|---|---|---|---|
| Osorto Nicolas | $300,000 | Avance Title Llc | |
| Moonsammy Tristan N | $275,430 | -- |
Source: Public Records
Mortgage History
| Date | Status | Borrower | Loan Amount |
|---|---|---|---|
| Open | Osorto Nicolas | $270,000 | |
| Previous Owner | Moonsammy Tristan N | $270,440 | |
| Previous Owner | Moonsammy Tristan N | $9,640 |
Source: Public Records
Tax History
| Year | Tax Paid | Tax Assessment Tax Assessment Total Assessment is a certain percentage of the fair market value that is determined by local assessors to be the total taxable value of land and additions on the property. | Land | Improvement |
|---|---|---|---|---|
| 2025 | $3,628 | $389,400 | $108,000 | $281,400 |
| 2024 | $3,628 | $364,800 | $102,400 | $262,400 |
| 2023 | $3,508 | $337,100 | $89,000 | $248,100 |
| 2022 | $3,545 | $312,900 | $85,500 | $227,400 |
| 2021 | $3,553 | $290,300 | $85,500 | $204,800 |
| 2020 | $4,242 | $273,700 | $85,500 | $188,200 |
| 2019 | $4,117 | $265,600 | $76,900 | $188,700 |
| 2018 | $3,060 | $253,400 | $76,900 | $176,500 |
| 2017 | $3,133 | $253,300 | $76,900 | $176,400 |
| 2016 | $3,112 | $254,000 | $76,900 | $177,100 |
| 2015 | $916 | $247,000 | $75,000 | $172,000 |
| 2014 | $916 | $75,000 | $75,000 | $0 |
Source: Public Records
Map
Nearby Homes
- 8206 Heritage Crossing Ct
- 9920 Whitemoss Dr
- 8535 Fortrose Dr
- 8383 Irongate Way
- 8411 Impalla Dr
- 8555 Fortrose Dr
- 7974 Community Dr
- 8323 Rolling Rd
- 8300 Highland St
- 9507 Scarlet St
- 9847 Alan Ct
- 8830 Tanglewood Ln
- 8896 Sweetbriar St
- 9505 Spotsylvania St
- 9501 Westmoreland Ave
- 8928 Rolling Rd
- 10127 Lomond Dr
- 8362 Gaither St
- 9649 Norfolk St
- 8622 Braxted Ln
- 8321 Scotland Loop
- 8323 Scotland Loop
- 8319 Scotland Loop
- 8327 Scotland Loop
- 8322 Scotland Loop Unit 31
- 8324 Scotland Loop Unit 30
- 8324 Scotland Loop
- 8314 Scotland Loop
- 8326 Scotland Loop Unit 29
- 8333 Scotland Loop Unit 48
- 8333 Scotland Loop
- 8310 Scotland Loop
- Scotland Loop
- Scotland Loop
- Scotland Loop
- 8330 Scotland Loop
- 8332 Scotland Loop
- 8306 Scotland Loop
- 8306 Scotland Loop Unit 37
- 8339 Scotland Loop
Your Personal Tour Guide
Ask me questions while you tour the home.