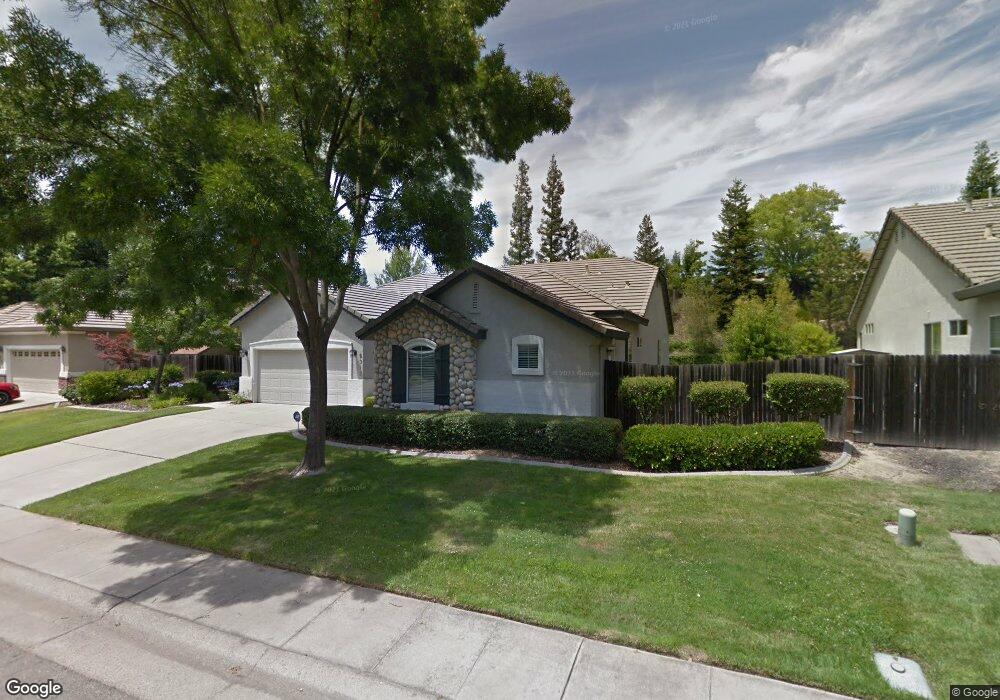
8313 Yvonne Way Fair Oaks, CA 95628
Estimated Value: $647,000 - $786,000
4
Beds
3
Baths
2,201
Sq Ft
$328/Sq Ft
Est. Value
About This Home
This home is located at 8313 Yvonne Way, Fair Oaks, CA 95628 and is currently estimated at $721,660, approximately $327 per square foot. 8313 Yvonne Way is a home located in Sacramento County with nearby schools including Northridge Elementary School, Andrew Carnegie Middle School, and Bella Vista High School.
Ownership History
Date
Name
Owned For
Owner Type
Purchase Details
Closed on
Sep 14, 2010
Sold by
Doris Dennis A and Doris Adrienne J
Bought by
Doris Dennis A and Doris Adrienne J
Current Estimated Value
Home Financials for this Owner
Home Financials are based on the most recent Mortgage that was taken out on this home.
Original Mortgage
$100,000
Interest Rate
4.45%
Mortgage Type
New Conventional
Purchase Details
Closed on
Jan 24, 2005
Sold by
Doris Dennis A and Doris Adrienne J
Bought by
Revocab Dennis A and Revocab Adrienne J Doris 2005
Purchase Details
Closed on
Feb 10, 1999
Sold by
Beazer Homes Holdings Corp
Bought by
Doris Dennis A and Doris Adrienne J
Home Financials for this Owner
Home Financials are based on the most recent Mortgage that was taken out on this home.
Original Mortgage
$145,000
Interest Rate
6.78%
Create a Home Valuation Report for This Property
The Home Valuation Report is an in-depth analysis detailing your home's value as well as a comparison with similar homes in the area
Home Values in the Area
Average Home Value in this Area
Purchase History
| Date | Buyer | Sale Price | Title Company |
|---|---|---|---|
| Doris Dennis A | -- | Fidelity National Title Comp | |
| Doris Dennis A | -- | Fidelity Natl Title Co Of Ca | |
| Revocab Dennis A | -- | -- | |
| Doris Dennis A | $225,000 | First American Title Co |
Source: Public Records
Mortgage History
| Date | Status | Borrower | Loan Amount |
|---|---|---|---|
| Closed | Doris Dennis A | $100,000 | |
| Closed | Doris Dennis A | $145,000 |
Source: Public Records
Tax History Compared to Growth
Tax History
| Year | Tax Paid | Tax Assessment Tax Assessment Total Assessment is a certain percentage of the fair market value that is determined by local assessors to be the total taxable value of land and additions on the property. | Land | Improvement |
|---|---|---|---|---|
| 2025 | $4,259 | $353,503 | $117,565 | $235,938 |
| 2024 | $4,259 | $346,572 | $115,260 | $231,312 |
| 2023 | $4,135 | $339,777 | $113,000 | $226,777 |
| 2022 | $4,118 | $333,116 | $110,785 | $222,331 |
| 2021 | $4,038 | $326,585 | $108,613 | $217,972 |
| 2020 | $3,980 | $323,237 | $107,500 | $215,737 |
| 2019 | $3,879 | $316,900 | $105,393 | $211,507 |
| 2018 | $3,794 | $310,687 | $103,327 | $207,360 |
| 2017 | $3,755 | $304,596 | $101,301 | $203,295 |
| 2016 | $3,511 | $298,624 | $99,315 | $199,309 |
| 2015 | $3,450 | $294,140 | $97,824 | $196,316 |
| 2014 | $3,378 | $288,379 | $95,908 | $192,471 |
Source: Public Records
Map
Nearby Homes
- 5020 Cozzins Ct
- 5101 Cocoa Palm Way
- 5137 Kauai Way
- 5001 Shamrock Dr
- 4924 Buena Vista Ave
- 7948- Sunset Ave
- 5343 Maui Way
- 11330 Fair Oaks Blvd
- 11330 Fair Oaks Blvd Unit 102A
- 8366 Madison Ave
- 8464 Sunset Ave
- 5137 Kenneth Ave
- 8461 Caslan Ave
- 8072 Dorian Way
- 8200 Shangrila Dr
- 4551 Oxbow Ridge Place
- 8140 Maderia Port Ln
- 8063 Youngheart Ln
- 8514 Bordeaux Way
- 8028 Vintage Way
- 8323 Yvonne Way
- 8301 Yvonne Way
- 5029 Chicago Ave
- 5014 Osgood Way
- 8335 Yvonne Way
- 8312 Yvonne Way
- 8322 Yvonne Way
- 5021 Cozzins Ct
- 5020 Osgood Way
- 8300 Yvonne Way
- 5033 Chicago Ave
- 8334 Yvonne Way
- 8345 Yvonne Way
- 5026 Osgood Way
- 8317 Willowdale Way
- 4977 Chicago Ave
- 5037 Chicago Ave
- 5034 Chicago Ave
- 8344 Yvonne Way
- 5021 Osgood Way