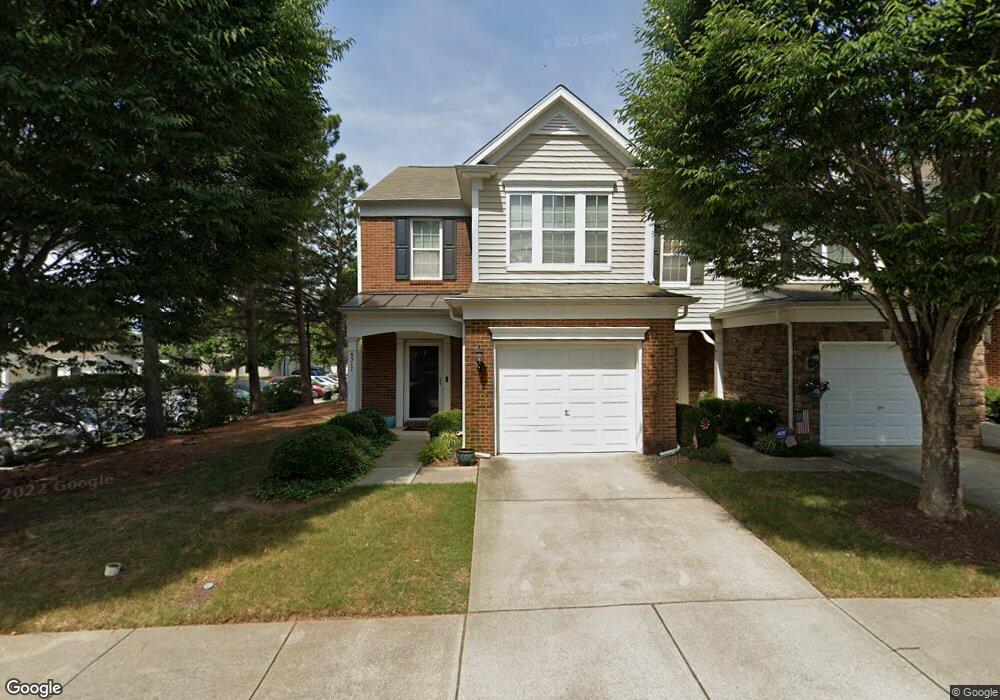
8317 Pilots View Dr Raleigh, NC 27617
Northwest Raleigh NeighborhoodEstimated Value: $348,000 - $376,000
3
Beds
3
Baths
1,600
Sq Ft
$226/Sq Ft
Est. Value
About This Home
This home is located at 8317 Pilots View Dr, Raleigh, NC 27617 and is currently estimated at $360,907, approximately $225 per square foot. 8317 Pilots View Dr is a home located in Wake County with nearby schools including Leesville Road Elementary School, Leesville Road Middle School, and Leesville Road High School.
Ownership History
Date
Name
Owned For
Owner Type
Purchase Details
Closed on
Jul 19, 2021
Sold by
Volpe Thomas J and Volpe Donna J
Bought by
Vested Realty Llc
Current Estimated Value
Purchase Details
Closed on
Dec 19, 2019
Sold by
Meyer Tanya
Bought by
Volpe Donna J and Volpe Thomas J
Home Financials for this Owner
Home Financials are based on the most recent Mortgage that was taken out on this home.
Original Mortgage
$180,000
Interest Rate
3.6%
Mortgage Type
New Conventional
Purchase Details
Closed on
May 14, 2015
Sold by
Gay Caroline L and Gay Daniel T
Bought by
Meyer Tanya
Purchase Details
Closed on
Aug 15, 2008
Sold by
Pulte Home Corp
Bought by
Brown Caroline L
Home Financials for this Owner
Home Financials are based on the most recent Mortgage that was taken out on this home.
Original Mortgage
$191,906
Interest Rate
6.31%
Mortgage Type
FHA
Create a Home Valuation Report for This Property
The Home Valuation Report is an in-depth analysis detailing your home's value as well as a comparison with similar homes in the area
Home Values in the Area
Average Home Value in this Area
Purchase History
| Date | Buyer | Sale Price | Title Company |
|---|---|---|---|
| Vested Realty Llc | -- | None Available | |
| Volpe Donna J | $240,000 | Nationwide Title Clearing | |
| Volpe Donna J | $240,000 | None Listed On Document | |
| Meyer Tanya | $177,000 | None Available | |
| Brown Caroline L | $194,000 | None Available |
Source: Public Records
Mortgage History
| Date | Status | Borrower | Loan Amount |
|---|---|---|---|
| Previous Owner | Volpe Donna J | $180,000 | |
| Previous Owner | Brown Caroline L | $191,906 |
Source: Public Records
Tax History
| Year | Tax Paid | Tax Assessment Tax Assessment Total Assessment is a certain percentage of the fair market value that is determined by local assessors to be the total taxable value of land and additions on the property. | Land | Improvement |
|---|---|---|---|---|
| 2025 | $3,119 | $355,367 | $110,000 | $245,367 |
| 2024 | $3,106 | $355,367 | $110,000 | $245,367 |
Source: Public Records
Map
Nearby Homes
- 8323 Pilots View Dr
- 8325 Pilots View Dr
- 8204 Pilots View Dr
- 8310 Chimneycap Dr
- 8216 Beaded Stone St
- 8441 Lunar Stone Place
- 8498 Central Dr
- 7751 San Gabriel St
- 8211 Clasara Cir
- 8041 Sycamore Hill Ln
- 8729 Cypress Grove Run
- 8228 Clarks Branch Dr
- 8016 Sycamore Hill Ln
- 8005 Sycamore Hill Ln
- 8006 Goldenrain Way
- 8815 Orchard Grove Way
- 7710 Astoria Place
- 8015 Sunset Branch Ct
- 7714 Cloudview Ln
- 7617 Derek Dr
- 8319 Pilots View Dr
- 8313 Pilots View Dr Unit 31
- 8321 Pilots View Dr
- 8322 Saltwood Place
- 8324 Saltwood Place
- 8326 Saltwood Place
- 8316 Pilots View Dr
- 8316 Pilots View Dr Unit 30
- 8328 Saltwood Place
- 8318 Pilots View Dr
- 8320 Pilots View Dr
- 8322 Pilots View Dr
- 8327 Pilots View Dr
- 8314 Pilots View Dr
- 8314 Pilots View Dr Unit 29
- 8330 Saltwood Place
- 8324 Pilots View Dr
- 8324 Pilots View Dr Unit 34
- 8312 Pilots View Dr
- 8326 Pilots View Dr
Your Personal Tour Guide
Ask me questions while you tour the home.